
Page 1225 - How to Make Money in Stocks Trilogy
P. 1225
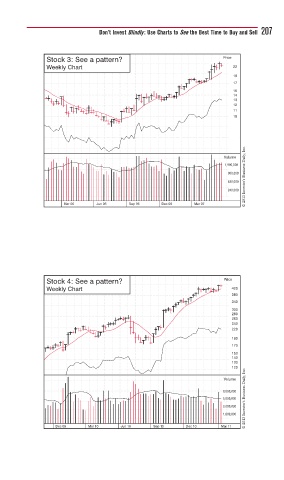
Don’t Invest Blindly: Use Charts to See the Best Time to Buy and Sell 207


              Stock 3: See a pattern?                           Price
              Weekly Chart                                        22
                                                                  19
                                                                  17
                                                                  15
                                                                  14
                                                                  13
                                                                  12
                                                                  11
                                                                  10


                                                                      © 2013 Investor’s Business Daily, Inc.
                                                                Volume
                                                                1,900,000
                                                                 960,000
                                                                 480,000
                                                                 240,000

                   Mar 06   Jun 06   Sep 06   Dec 06   Mar 07


              Stock 4: See a pattern?                           Price
              Weekly Chart                                        420
                                                                  380
                                                                  340
                                                                  300
                                                                  280
                                                                  260
                                                                  240
                                                                  220
                                                                  190
                                                                  170
                                                                  150
                                                                  140
                                                                  130
                                                                  120
                                                                      © 2013 Investor’s Business Daily, Inc.
                                                                Volume
                                                               8,000,000
                                                               5,000,000
                                                               3,000,000
                                                               1,800,000
                 Dec 09   Mar 10   Jun 10   Sep 10   Dec 10    Mar 11