Page 1229 - How to Make Money in Stocks Trilogy
P. 1229

Don’t Invest Blindly: Use Charts to See the Best Time to Buy and Sell 211


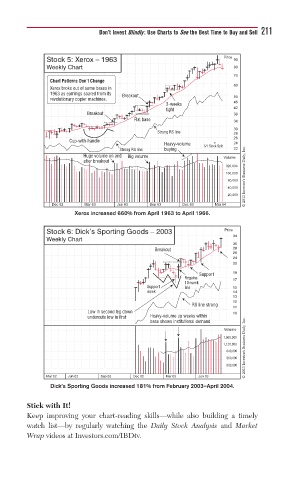
              Stock 5: Xerox – 1963                             Price  90
              Weekly Chart                                        80
                                                                  70
               Chart Patterns Don’t Change
                                                                  60
               Xerox broke out of same bases in
               1963 as earnings soared from its   Breakout
               revolutionary copier machines.                     50
                                                3-weeks           46
                                                tight             42
                         Breakout                                 38
                                       Flat base                  34
                                                                  30
                                             Strong RS line       28
                                                                  26
                    Cup-with-handle
                                               Heavy-volume  5/1 Stock Split  24
                                   Strong RS line  buying         22
                        Huge volume on and   Big volume         Volume
                        after breakout
                                                                320,000
                                                                160,000 © 2013 Investor’s Business Daily, Inc.
                                                                 80,000
                                                                 40,000
                                                                 20,000
                Dec 62   Mar 63   Jun 63   Sep 63   Dec 63   Mar 64
                      Xerox increased 660% from April 1963 to April 1966.

              Stock 6: Dick’s Sporting Goods – 2003             Price
                                                                  34
              Weekly Chart
                                                                  30
                                            Breakout              28
                                                                  26
                                                                  24
                                                                  22
                                                         Support  19
                                                     Regains      17
                                                     10-week
                                          Support    line         15
                                          week                    14
                                                                  13
                                                                  12
                                                       RS line strong
                                                                  11
                          Low in second leg down                  10
                          undercuts low in first  Heavy-volume up weeks within
                                                                      © 2013 Investor’s Business Daily, Inc.
                                           base shows institutional demand
                                                                Volume
                                                                1,960,000
                                                                1,120,000
                                                                640,000
                                                                360,000
                                                                200,000
              Mar 02  Jun 02  Sep 02  Dec 02   Mar 03    Jun 03
               Dick’s Sporting Goods increased 181% from February 2003–April 2004.
         Stick with It!
         Keep improving your chart-reading skills—while also building a timely
         watch list—by regularly watching the  Daily Stock Analysis and  Market
         Wrap videos at Investors.com/IBDtv.
   1224   1225   1226   1227   1228   1229   1230   1231   1232   1233   1234