Page 1228 - How to Make Money in Stocks Trilogy
P. 1228

210  HOW TO MAKE MONEY IN STOCKS—GETTING STARTED


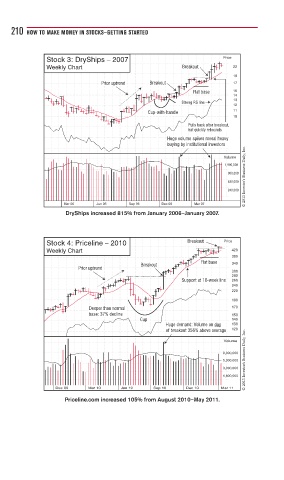
              Stock 3: DryShips – 2007                          Price
              Weekly Chart                          Breakout      22
                                                                  19
                             Prior uptrend  Breakout              17
                                                       Flat base  15
                                                                  14
                                                                  13
                                                    Strong RS line
                                                                  12
                                          Cup-with-handle         11
                                                                  10
                                                      Pulls back after breakout,
                                                      but quickly rebounds
                                                Huge volume spikes reveal heavy
                                                buying by institutional investors
                                                                      © 2013 Investor’s Business Daily, Inc.
                                                                Volume
                                                                1,900,000
                                                                 960,000
                                                                 480,000
                                                                 240,000

                   Mar 06   Jun 06   Sep 06   Dec 06   Mar 07
                   DryShips increased 815% from January 2006–January 2007.


              Stock 4: Priceline – 2010               Breakout  Price
              Weekly Chart                                        420
                                                                  380
                                                         Flat base
                                        Breakout                  340
                       Prior uptrend
                                                                  300
                                                                  280
                                                    Support at 10-week line  260
                                                                  240
                                                                  220
                                                                  190
                          Deeper than normal                      170
                          base: 37% decline                       150
                                        Cup                       140
                                               Huge demand: Volume on day  130
                                               of breakout 356% above average  120
                                                                      © 2013 Investor’s Business Daily, Inc.
                                                                Volume
                                                               8,000,000
                                                               5,000,000
                                                               3,000,000
                                                               1,800,000
                 Dec 09   Mar 10   Jun 10   Sep 10   Dec 10    Mar 11
                   Priceline.com increased 105% from August 2010–May 2011.
   1223   1224   1225   1226   1227   1228   1229   1230   1231   1232   1233