Page 1227 - How to Make Money in Stocks Trilogy
P. 1227

Don’t Invest Blindly: Use Charts to See the Best Time to Buy and Sell 209


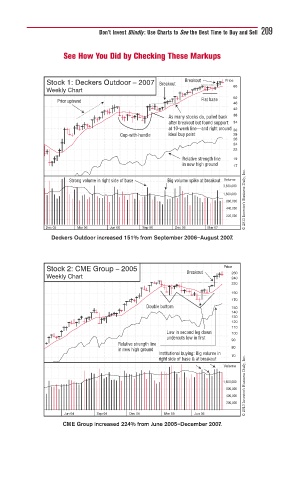
                   See How You Did by Checking These Markups


                                                     Breakout   Price
              Stock 1: Deckers Outdoor – 2007  Breakout
                                                                  60
              Weekly Chart
                 Prior uptrend                           Flat base  50
                                                                  46
                                                                  42
                                                As many stocks do, pulled back  38
                                                after breakout but found support  34
                                                at 10-week line—and right around  30
                                   Cup-with-handle  ideal buy point  28
                                                                  26
                                                                  24
                                                                  22
                                                    Relative strength line  19
                                                    in new high ground  17
                                                                      © 2013 Investor’s Business Daily, Inc.
                    Strong volume in right side of base  Big volume spike at breakout  Volume
                                                                3,500,000
                                                                1,660,000
                                                                860,000
                                                                440,000
                                                                220,000
              Dec 05   Mar 06   Jun 06   Sep 06   Dec 06   Mar 07
               Deckers Outdoor increased 151% from September 2006–August 2007.


              Stock 2: CME Group – 2005                         Price
                                                     Breakout     260
              Weekly Chart                                        240
                                                                  220
                                                                  190
                                                                  170
                                          Double bottom           150
                                                                  140
                                                                  130
                                                                  120
                                                                  110
                                                Low in second leg down   100
                                                undercuts low in first  90
                                  Relative strength line
                                                                  80
                                  in new high ground
                                              Institutional buying: Big volume in   70
                                                                      © 2013 Investor’s Business Daily, Inc.
                                              right side of base & at breakout
                                                                Volume
                                                                1,600,000
                                                                800,000
                                                                400,000
                                                                200,000
                   Jun 04   Sep 04   Dec 04    Mar 05  Jun 05
                   CME Group increased 224% from June 2005–December 2007.
   1222   1223   1224   1225   1226   1227   1228   1229   1230   1231   1232