
Page 168 - How to Make Money in Stocks Trilogy
P. 168
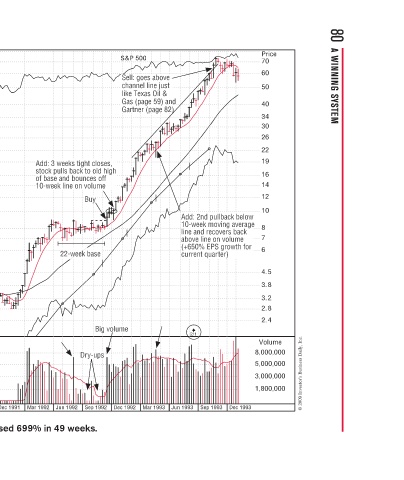
80  A WINNING SYSTEM


          Price  70  60  50  40  34  30  26  22  19  16  14  12  10  w  e  g  8  7  6  4.5  3.8  3.2  2.8  2.4  Volume  8,000,000  5,000,000  3,000,000  1,800,000  © 2009 Investor’s Business Daily, Inc.

                                     Add: 2nd pullback below  a  l  2 10-week moving average  v  g  g  v  m  e line and recovers back  b  r  o  e  n above line on volume above line on volume  m  o  n  e  e (+650% EPS growth for   t  gro  S  E  0  current quarter)  )  t  u  n  Dec 1993 Sep 1993


                  d                  d  -  e  o  6  (  r  2/1        Jun 1993
              e  o  n  )  9  2  e                                    Mar 1993
           S&P 500  Sell: goes above  o  l  S  S  S  S  channel line just t channel line just  n  e  a  c  like Texas Oil &  e  e  l  Gas (page 59) an  g  (p  p  s  G  Gartner (page 82) Gartner (page 82)  p  p  e  r  G  g  ff  e  Big volume  olume  m  o  Dec 1992

                             Add: 3 weeks tight closes, Add: 3 weeks tight closes,  s  c  g  s  e  3 stock pulls back to old high  o  k  a  p of base and bounces off  f  s  b  db  n  fb 10-week line on volume 10-week line on volume  u  e  y  Buy  B  week base  a  week  k  22-wee  w  2  g  g  g  s  y-ups Dry-ups  u


                                                                     Dec 1991 Mar 1992

                                                                     Sep 1991 Newbridge Networks increased 699% in 49 weeks.

                                                                     Jun 1991

                                                                     Mar 1991

                                                                     Dec 1990

                                                                     Sep 1990 Jun 1990
           Newbridge Networks–1992  Weekly Chart  O  O               Mar 1990 Dec 1989 Sep 1989


          Price =  20*eps   3.00   2.50    2.25   2.00   1.80   1.60    1.50    1.40    1.30    1.20    1.10    1.00    0.90   0.80   0.75    0.70   0.65    0.60    0.55    0.50   0.45   0.40   IPO  IPO  P   0.35   *  *   0.30    0.25    0.23    0.20    0.18    0.16    0.15    0.14    0.13    0.12    0.11