
Page 165 - How to Make Money in Stocks Trilogy
P. 165
© 2009 Investor’s Business Daily, Inc.
4,000,000
2,000,000
7,000,000
12,000,000
Volume
Price
4.0
3.4
2.6
3.0
5
Mar 1994
Dec 1993
Sep 1993
S&P 500
Jun 1993
2/1
Mar 1993
Dec 1992
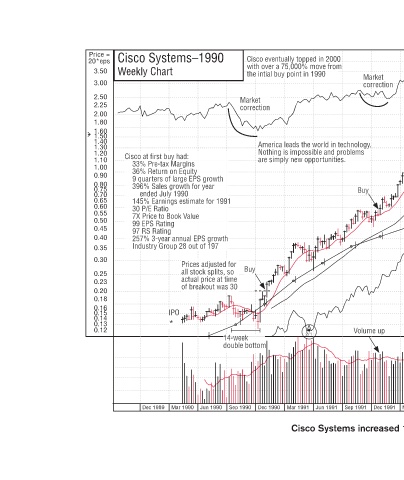
Cisco Systems increased 1602% in 169 weeks.
Volume up
p
Market
Sep 1992
k
M
V
Jun 1992
2/1
Mar 1992
Dec 1991
Volume up
Market 70 correction correction i e o Buy u a 60 correction correction r 50 40 Tech stock built lots of bases f l u k t h T T Buy y 34 and had numerous pullbacks and had numerous pullbacks p e n a d 30 gy y y 26 22 19 16 Buy 14 12 10 8 7 6 America’s Greatest
m
0 0 m 1990 e r s Sep 1991 Jun 1991
Cisco eventually topped in 2000 Cisco eventually topped in 2000 d a s with over a 75,000% move from m 7 t the intial buy point in 1990 t i i y l b ti i the Market t Mke correction c America leads the world in technology. w l Nothing is impossible and problems i py new opportunities.
Cisco Systems–1990 Weekly Chart Cisco at first buy had: y u o 33% Pre-tax Margins i M x 33% P % 36% Return on Equity 36% Return on Equity % 9 quarters of large EPS growth S f q 396% Sales growth for year 396% Sales growth for year 6 ended July 1990 ended July 1990 y
Price = 20*eps 3.50 3.00 2.50 2.25 2.00 1.80 1.60 1.50 1.40 1.30 1.20 1.10 1.00 0.90 0.80 0.75 0.70 0.65 0.60 0.55 0.50 0.45 0.40 0.35 0.30 0.25 0.23 0.20 0.18 0.16 0.15 0.14 0.13 0.12