
Page 163 - How to Make Money in Stocks Trilogy
P. 163
78
A WINNING SYSTEM
1,120,000
1,940,000
640,000
360,000
200,000
Volume
Price
1.7
2.0
2.4
3.2
2.8
4.5
3.8
12
22
10
14
16
34
50
40
26
30
19
7
8
6
S&P 500
p
Volume up
p
t closes
closes
e
e
2/1
lu
l
Tight c
ht c
Tight c
V
V
Volume up
p
p
T
T
T
T
e
erage line
e
week moving average line
bounce back above 10-
Add: 8-week base and
u
0
d
Add: 8-week baseand
a
e
a
V
week moving ave
s
v
b
2/1
to 10-week moving
g
g
g
g
above 1st pullback
above 1st pullback
k
n
k
on volume
on volume
Volume up
p
Volume up
m
correction
n
o
b
w
o
se
e
Add: recovers
i
e
8
e
e
Buy: base-on-ba
a
average line
l
Market t
p
c
c
k
formed during
general market
g
li
u
s
u
n
n
e
r
k
c
e
r
g
V
V
correction
correction
m
v
0
d
o
Add:
s
r
b
c
o
v
e
r
A
Earnings acceleration
Earnings acceleration
n
t
s
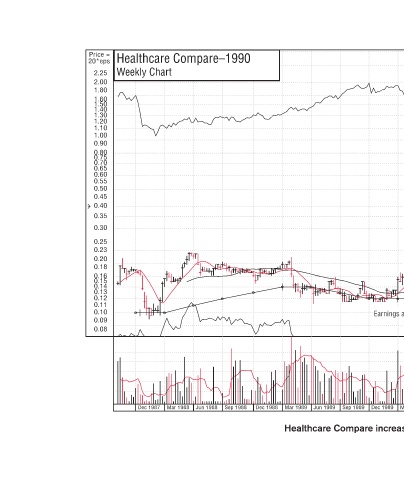
Sep 1989 Mar 1992 Dec 1991 Sep 1991 Jun 1991 Mar 1991 Dec 1990 Sep 1990 Jun 1990 Mar 1990 Dec 1989 © 2009 Investor’s Business Daily, Inc. Healthcare Compare increased 540% in 61 weeks.
Jun 1989
Mar 1989
Dec 1988 Sep 1988
Healthcare Compare–1990 Weekly Chart Jun 1988 Mar 1988 Dec 1987
Price = 20*eps 2.25 2.00 1.80 1.60 1.50 1.40 1.30 1.20 1.10 1.00 0.90 0.80 0.75 0.70 0.65 0.60 0.55 0.50 0.45 0.40 0.35 0.30 0.25 0.23 0.20 0.18 0.16 0.15 0.14 0.13 0.12 0.11 0.10 0.09 0.08