
Page 230 - How to Make Money in Stocks Trilogy
P. 230
How to Read Charts Like a Pro and Improve Your Selection and Timing 113
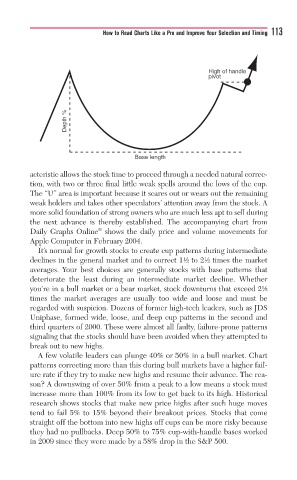
High of handlegg
pivot
%
Depth
Base length
acteristic allows the stock time to proceed through a needed natural correc-
tion, with two or three final little weak spells around the lows of the cup.
The “U” area is important because it scares out or wears out the remaining
weak holders and takes other speculators’ attention away from the stock. A
more solid foundation of strong owners who are much less apt to sell during
the next advance is thereby established. The accompanying chart from
®
Daily Graphs Online shows the daily price and volume movements for
Apple Computer in February 2004.
It’s normal for growth stocks to create cup patterns during intermediate
declines in the general market and to correct 1½ to 2½ times the market
averages. Your best choices are generally stocks with base patterns that
deteriorate the least during an intermediate market decline. Whether
you’re in a bull market or a bear market, stock downturns that exceed 2½
times the market averages are usually too wide and loose and must be
regarded with suspicion. Dozens of former high-tech leaders, such as JDS
Uniphase, formed wide, loose, and deep cup patterns in the second and
third quarters of 2000. These were almost all faulty, failure-prone patterns
signaling that the stocks should have been avoided when they attempted to
break out to new highs.
A few volatile leaders can plunge 40% or 50% in a bull market. Chart
patterns correcting more than this during bull markets have a higher fail-
ure rate if they try to make new highs and resume their advance. The rea-
son? A downswing of over 50% from a peak to a low means a stock must
increase more than 100% from its low to get back to its high. Historical
research shows stocks that make new price highs after such huge moves
tend to fail 5% to 15% beyond their breakout prices. Stocks that come
straight off the bottom into new highs off cups can be more risky because
they had no pullbacks. Deep 50% to 75% cup-with-handle bases worked
in 2009 since they were made by a 58% drop in the S&P 500.