
Page 232 - How to Make Money in Stocks Trilogy
P. 232
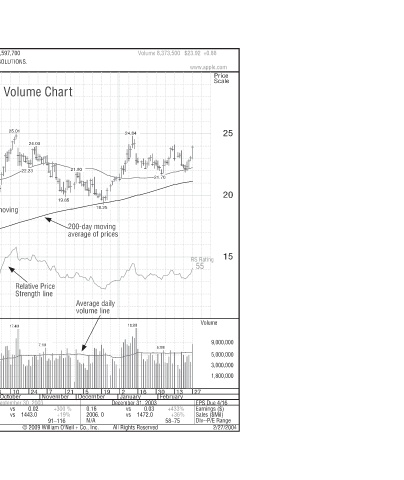
Volume 8,373,500   $23.92  +0.88  www.apple.com  Price  Scale  25  21.70  20  15  RS Rating  55  Volume  9,000,000  6.3M  5,000,000  3,000,000  1,800,000  27  13  30  February  EPS Due 4/16  Earnings ($)  +433%  Sales ($Mil)  +36%     Div--P/E Range  58–75  2/27/2004


                                                       18.2M
                       24.84
                                                                  2  16  January  December 31, 2003      0.03    vs   vs    1472.0    All Rights Reserved
                                        s
                                    19.25  200-day moving   n  o  average of prices average of prices  c  p  p  p  y Average daily  l  d  g  g  volume line  i  m  19  December  0.16  2006. 0  A  /
                             21.90  19.85  00-d  g  vera  Relative Price  i  e  Strength line Strength line  n  g h  ve  l  7.1M  5  21  7  24  November  +300 %      0.02   +19%     N  91–116                © 2009 William O’Neil + Co., Inc.
                 rt
                 h
                 C
                 me
                         24.00
          Average Daily Volume 5,597,700   Price and Volume Chart  um  o  nd  a  e  i  25.01  23.32  22.23  20.1 5  moving  g  i  50-day m  50-day m  m  d  50-  age  average  g  g  g  g  ave  e  a  t  e  n  t  17.4M  10.3M  26 October 10  12  29  September  September 30, 2003   vs  0.08   vs    1443.0  1715. 0  A


                 Daily  P  y  y  y  y  a  D  19.42         5.7M   15  1  August  -44%      0.09   +8%  90–140

          Computer-manufacturers DESIGNS, MANUFACTURES AND MARKETS PERSONAL COMPUTERS AND RELATED PERSONAL COMPUTING SOLUTIONS.  81   E   C   B  55  B   N/A  72 (2.5 x SP)     $8.67 Bil   362.5 Mil   24%  21.57  19.69  13.4M  9.2M  18  4  20  July  June 30, 2003   vs  0.05   vs    1429.0 1545. 0  A  /


          NASDAQ  EPS Rating  Group RS Rating  SMR Rating  cc/Dis Rating  Composite Rating  Timeliness Rating  Growth Rate  P/E  Mkt Cap  Shares  Funds  19.00  16.63  6  23  9  June  -64%  -1%     N  75–85                                                                   Daily Graphs Online       E-mail: custserv@d
          Apple Computer Inc.           (AAPL)  Price ($)  EPS  Year  High Low   ($)   (Sep)  16  59  0.85  1998  16  59  1.21  1999  13  75  1.69  2000  14  27  -0.19  2001  13  26  0.32  2002  12  25  0.20  2003  130%  est.  0.46  2004  30%  est.  0.60  2005  14.95  27.8M  24.9M  25 May 11  28  14  April  March 3


                                       114