
Page 233 - How to Make Money in Stocks Trilogy
P. 233
How to Read Charts Like a Pro and Improve Your Selection and Timing 115
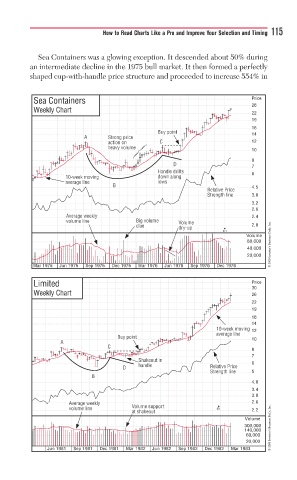
Sea Containers was a glowing exception. It descended about 50% during
an intermediate decline in the 1975 bull market. It then formed a perfectly
shaped cup-with-handle price structure and proceeded to increase 554% in
Sea Containers Price
26
Weekly Chart 22
19
16
Buy pointypuy poi t
A Strong pricei 14
Strong
action
action ononn C C C 12
a
h heavy volumey y y u 10
8
D 7
Handle dria f stst 6
10-week movingvweek g down alonggao
average lineage l lowsw
B 4.5
R Relativeltia P P Pricei
Strength linelinee 3.8
Strength
3.2
2.8
A Average weeklyverage weeklya y y 2.4
volume linem Big volummvolum e V Volumem e
clue
clue d d d dry-upu 2.0
2/1
Volume
80,000 © 2009 Investor’s Business Daily, Inc.
40,000
20,000
Mar 1975 Jun 1975 Sep 1975 Dec 1975 Mar 1976 Jun 1976 Sep 1976 Dec 1976
Limited Price
30
Weekly Chart 26
22
19
16
14
10-week movingg0-we 12
average lineverag
Buy pointypy t n 10
A
C
8
7
Shakeout inneh n 6
handlelea
D D hd R Relativei P Price
Strength lineline
Stren
Strength 5
B
4.0
3.4
3.0
A A Average weeklyverage weeklywg y y 2.6
volume linenolum V Volume supposuppom rtt 2/1 2.2
at a at shakeoutshakeoutoa
Volume
300,000 © 2009 Investor’s Business Daily, Inc.
140,000
60,000
20,000
Jun 1981 Sep 1981 Dec 1981 Mar 1982 Jun 1982 Sep 1982 Dec 1982 Mar 1983