
Page 262 - How to Make Money in Stocks Trilogy
P. 262
How to Read Charts Like a Pro and Improve Your Selection and Timing 143
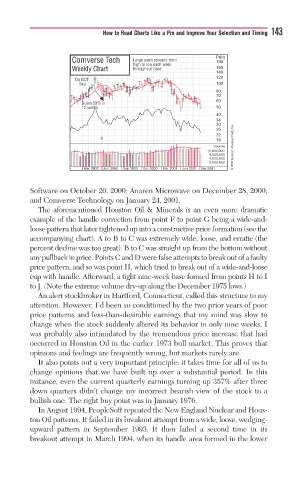
Comverse Tech Large point spreads fromgpoint p e s fro m Price
Large
190
high to low each weekh
hi high low e h e k
h
Weekly Chart throughout 160
throughout basebaseeout b
throu
140
120
D Do NOTNOTNOT
Buyu
Buy 100
80
70
60
D D Down 50% i50%50%w n i
12 weeksweekskw k 50
12
1
40
34
30
26
22
2/1 19
Volume © 2009 Investor’s Business Daily, Inc.
16,000,000
8,000,000
4,000,000
2,000,000
Mar 2000 Jun 2000 Sep 2000 Dec 2000 Mar 2001 Jun 2001 Sep 2001
Software on October 20, 2000; Anaren Microwave on December 28, 2000;
and Comverse Technology on January 24, 2001.
The aforementioned Houston Oil & Minerals is an even more dramatic
example of the handle correction from point F to point G being a wide-and-
loose pattern that later tightened up into a constructive price formation (see the
accompanying chart). A to B to C was extremely wide, loose, and erratic (the
percent decline was too great). B to C was straight up from the bottom without
any pullback in price. Points C and D were false attempts to break out of a faulty
price pattern, and so was point H, which tried to break out of a wide-and-loose
cup with handle. Afterward, a tight nine-week base formed from points H to I
to J. (Note the extreme volume dry-up along the December 1975 lows.)
An alert stockbroker in Hartford, Connecticut, called this structure to my
attention. However, I’d been so conditioned by the two prior years of poor
price patterns and less-than-desirable earnings that my mind was slow to
change when the stock suddenly altered its behavior in only nine weeks. I
was probably also intimidated by the tremendous price increase that had
occurred in Houston Oil in the earlier 1973 bull market. This proves that
opinions and feelings are frequently wrong, but markets rarely are.
It also points out a very important principle: it takes time for all of us to
change opinions that we have built up over a substantial period. In this
instance, even the current quarterly earnings turning up 357% after three
down quarters didn’t change my incorrect bearish view of the stock to a
bullish one. The right buy point was in January 1976.
In August 1994, PeopleSoft repeated the New England Nuclear and Hous-
ton Oil patterns. It failed in its breakout attempt from a wide, loose, wedging-
upward pattern in September 1993. It then failed a second time in its
breakout attempt in March 1994, when its handle area formed in the lower