
Page 257 - How to Make Money in Stocks Trilogy
P. 257
How to Read Charts Like a Pro and Improve Your Selection and Timing 139
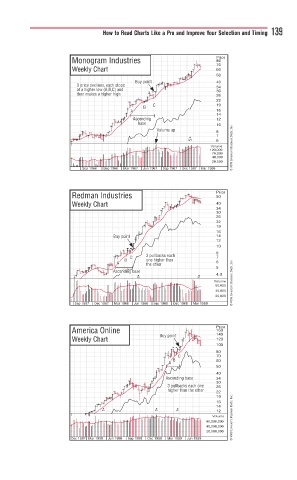
Monogram Industries Price
80
70
Weekly Chart 60
50
Buy
Buy pointpointi 40
Buy pointtyy
3 price declines, each stops stopaclinesep s 34
at a higher low (ghi h r lowg l ( (AA,B,C) and,,)BC)C) and, d 30
then makes a higher highhes a hme g gh g g 26
22
C C C C C 19
B B
A A A 16
14
A Ascendingn
Ascending 12
Ascendingnnn
A
basea basea 10
V Volume uppolume uppme up 8
7
3/1 6
Volume © 2009 Investor’s Business Daily, Inc.
120,000
70,000
40,000
20,000
Sep 1966 Dec 1966 Mar 1967 Jun 1967 Sep 1967 Dec 1967 Mar 1968
Redman Industries Price
50
Weekly Chart 40
34
30
26
22
19
16
Buy pointy
Buy y y yppointo oint 14
12
10
8
C C C C 3 3 pullbacks eachp llb ks eacullba h hh c 7
B B one higher thanthange
A A A A A A A th 6
the otherthh
5
Ascendind b
Ascendiddiending basesdingcending
4.0
4/3 2/1
Volume © 2009 Investor’s Business Daily, Inc.
80,000
40,000
20,000
Sep 1967 Dec 1967 Mar 1968 Jun 1968 Sep 1968 Dec 1968 Mar 1969
America Online Price
160
Buy 140
Buy point
Buy pointtpointny
Weekly Chart 120
100
80
C C C 70
B B B
A A A A A 60
50
40
A
Ascending basebasebendi g 34
Ascending
30
3 pullbacks each one 26
h h
llb kkllb
3 3 pullbacks each onech oksullb
higher than the othergher n e oth 22
19
16
14
2/1 2/1 2/1 12
Volume © 2009 Investor’s Business Daily, Inc.
80,000,000
40,000,000
20,000,000
Dec 1997 Mar 1998 Jun 1998 Sep 1998 Dec 1998 Mar 1999 Jun 1999