
Page 258 - How to Make Money in Stocks Trilogy
P. 258
140 A WINNING SYSTEM
Price
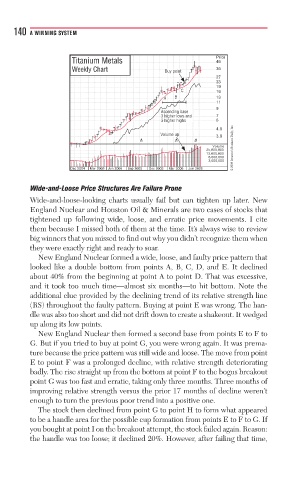
Titanium Metals 46
Weekly Chart Buy pointin nttt 36
B B
yppp
27
23
19
C C 16
A A A A B B 13
11
9
Ascending baseedingc
3 3 higher lows andhigher lows andaer loi 7
3 3 higher highshigher highser hii g g 6
4.6
V Volume uppolume uppeu 3.6
2/1 2/1 2/1
Volume © 2009 Investor’s Business Daily, Inc.
25,000,000
12,000,000
6,000,000
3,000,000
Dec 2004 Mar 2005 Jun 2005 Sep 2005 Dec 2005 Mar 2006 Jun 2006
Wide-and-Loose Price Structures Are Failure Prone
Wide-and-loose-looking charts usually fail but can tighten up later. New
England Nuclear and Houston Oil & Minerals are two cases of stocks that
tightened up following wide, loose, and erratic price movements. I cite
them because I missed both of them at the time. It’s always wise to review
big winners that you missed to find out why you didn’t recognize them when
they were exactly right and ready to soar.
New England Nuclear formed a wide, loose, and faulty price pattern that
looked like a double bottom from points A, B, C, D, and E. It declined
about 40% from the beginning at point A to point D. That was excessive,
and it took too much time—almost six months—to hit bottom. Note the
additional clue provided by the declining trend of its relative strength line
(RS) throughout the faulty pattern. Buying at point E was wrong. The han-
dle was also too short and did not drift down to create a shakeout. It wedged
up along its low points.
New England Nuclear then formed a second base from points E to F to
G. But if you tried to buy at point G, you were wrong again. It was prema-
ture because the price pattern was still wide and loose. The move from point
E to point F was a prolonged decline, with relative strength deteriorating
badly. The rise straight up from the bottom at point F to the bogus breakout
point G was too fast and erratic, taking only three months. Three months of
improving relative strength versus the prior 17 months of decline weren’t
enough to turn the previous poor trend into a positive one.
The stock then declined from point G to point H to form what appeared
to be a handle area for the possible cup formation from points E to F to G. If
you bought at point I on the breakout attempt, the stock failed again. Reason:
the handle was too loose; it declined 20%. However, after failing that time,