
Page 341 - How to Make Money in Stocks Trilogy
P. 341
M = Market Direction: How You Can Determine It 217
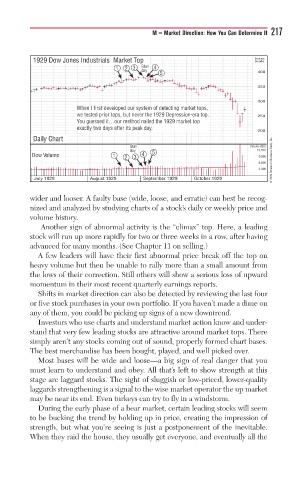
1929 Dow Jones Industrials Market Top Index
Scale
Stall
1 2 3 Stall y 4
day
d
day
5 400
350
300
W y g k et tops,
When
et tops,o
When I first developed our system of detecting markpI first developed our system of detecting markaetectinmslt
we
we tested prior tops, but never the 1929 Depression-tested prior tops, but never the 1929 Depressione tested p io tops b t ne e the 1929 Dep esssiono9 Depe 1929vuors
w -era top.era top.e a topa . . 250
-
Y Y Y You guessed it…our method nailed the 1929 market ou guessed itou guessed itdu our kk topp
top
our method nmethod nailed the 1929 market19299ed the dm
Y Y Y Y Y
exactly two days ay two ddays ay y f fter its peak dapter its peak daai y y y y.
e
exactly
200
Daily Chart
Stall Volume (00)
day
day y 13,200
Dow Volume 1 2 3 4 5 9,900
6,600 © 2009 Investor’s Business Daily, Inc.
3,300
July 1929 August 1929 September 1929 October 1929
wider and looser. A faulty base (wide, loose, and erratic) can best be recog-
nized and analyzed by studying charts of a stock’s daily or weekly price and
volume history.
Another sign of abnormal activity is the “climax” top. Here, a leading
stock will run up more rapidly for two or three weeks in a row, after having
advanced for many months. (See Chapter 11 on selling.)
A few leaders will have their first abnormal price break off the top on
heavy volume but then be unable to rally more than a small amount from
the lows of their correction. Still others will show a serious loss of upward
momentum in their most recent quarterly earnings reports.
Shifts in market direction can also be detected by reviewing the last four
or five stock purchases in your own portfolio. If you haven’t made a dime on
any of them, you could be picking up signs of a new downtrend.
Investors who use charts and understand market action know and under-
stand that very few leading stocks are attractive around market tops. There
simply aren’t any stocks coming out of sound, properly formed chart bases.
The best merchandise has been bought, played, and well picked over.
Most bases will be wide and loose—a big sign of real danger that you
must learn to understand and obey. All that’s left to show strength at this
stage are laggard stocks. The sight of sluggish or low-priced, lower-quality
laggards strengthening is a signal to the wise market operator the up market
may be near its end. Even turkeys can try to fly in a windstorm.
During the early phase of a bear market, certain leading stocks will seem
to be bucking the trend by holding up in price, creating the impression of
strength, but what you’re seeing is just a postponement of the inevitable.
When they raid the house, they usually get everyone, and eventually all the