
Page 451 - How to Make Money in Stocks Trilogy
P. 451
More Models of Great Stock Market Winners 321
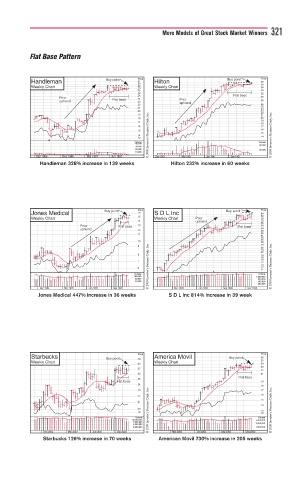
Flat Base Pattern
B
Buy point
Buy point
Handleman Buy pointiu Price Hilton Buy pointo Price
31
40
30 38
Weekly Chart 29 28 Weekly Chart 36
27 34
26 32
25 Fl Fla at baseb s e 30
P P Priori Flat basebaseeat e e 24 P Prior
Flat
u
uptrendn
uptrend d d 23 28
n
22 u uptrep nd d 26 25
21 24
20 23 22
19 21
18 20
17 19 18
16 17
15 16
14 © 2009 Investor’s Business Daily, Inc. 15 14 © 2009 Investor’s Business Daily, Inc.
13
3/2
Volume Volume
40,000 40,000
30,000
20,000 20,000
10,000
Sep 1966 Dec 1966 Mar 1967 Jun 1967 Dec 1967 Mar 1967 Jun 1967 Sep 1967
Handleman 328% increase in 139 weeks Hilton 232% increase in 60 weeks
Buy pointyy
Buy point
Jones Medical Buy point Price S D L Inc Buy pointn Price
16
94
Weekly Chart 15 Weekly Chart P P P P Priorrior 86 78
14 uptrendd 72
uptrend
u u u
66
P Priorriorr r r Fla tbbbasebaseb baseeb 13 Flat e e 60
F
Flat basebaseb
F
Fl F tat batla
Fla
uptrep e end d 12 54 49
11 45
41
38
10 35 32
© 2009 Investor’s Business Daily, Inc. 13 © 2009 Investor’s Business Daily, Inc.
9 29 26 24
8 22 19 18
7 16 15
6 12 11
Volume 2/1 Volume
160,000 1,600,000
80,000 800,000
40,000 400,000
200,000
Dec 1994 Mar 1995 Jun 1995 Sep 1995 Mar 1999 Jun 1999 Sep 1999 Dec 1999
Jones Medical 447% increase in 36 weeks S D L Inc 814% increase in 39 week
Starbucks Buy point Price America Movil Buy pointtppointp Price
Buy
Buy point
26
Buy point
Buy point
Buy pointo
B B B
29
Weekly Chart 28 Weekly Chart 25 24
23
27
22
26 21
Flat baset e
25
F Fl
Flat base e 19
24
18
23 17
22 16
21 15 14
20 © 2009 Investor’s Business Daily, Inc. © 2009 Investor’s Business Daily, Inc.
19 13 12
Volume Volume
12,000,000 5,000,000
7,000,000
4,000,000 3,000,000
2,000,000 1,600,000
Dec 2002 Mar 2003 Jun 2003 Sep 2003 Mar 2003 Jun 2003 Sep 2003 Dec 2003
Starbucks 126% increase in 70 weeks American Movil 730% increase in 205 weeks