
Page 447 - How to Make Money in Stocks Trilogy
P. 447
More Models of Great Stock Market Winners 317
Buy pointoo
yp
Qlogic B B Buy point Price Triquint Semi Buy pointnu yp nt Price
34
82
76 St Stt trong ppp pric 32
pricece
trong
Weekly Chart 70 64 Weekly Chart m m m move nb 30
n big big
move ononn
voo
olume
P P P P Priorrior 60 vo olume 28
u u u
u uptrenptren d d d d d 56 52 26
p
pen
48 25 24
45 23
42 22
39 21
36
33 19
31 18
29 17
27 16
25
23 15
21 Big voluml me 14
Bi
demandm
Bi B B B Big vog oluml o e V Volume dolume dooo r ryyyy 19 17 demand 13
upp
eeks
u u u
up wee eeks up p p in handlein handle e e 16
p
up we
15 © 2009 Investor’s Business Daily, Inc. 12 © 2009 Investor’s Business Daily, Inc.
14 11
2/1
Volume Volume
3,000,000 1,520,000
1,460,000 920,000
780,000 560,000
420,000 340,000
220,000 200,000
Sep 1998 Dec 1998 Mar 1999 Jun 1999 Sep 1998 Dec 1998 Mar 1999 Jun 1999
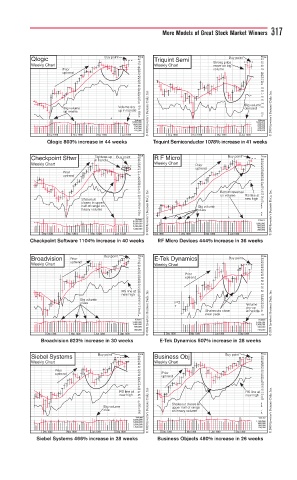
Qlogic 803% increase in 44 weeks Triquint Semiconductor 1078% increase in 41 weeks
Buy pointo
Checkpoint Sftwr T Tightens upgg n p p p Buy point Price R F Micro B Buy point Price
Buy
Buy point
Buy pointpoint
60
64
i in handlen handdle 56 58
Weekly Chart 52 49 Weekly Chart P P P P Priorrior 52
46 47
u u u
uptrend
uptrend
43 uptrenddn 43
P P Priorrior 40 39 35
uptrendddd
u
uptrend 37 32
uptrend
34 29
32 26
30 23
28 21
26 19
24 17
B
Bottom
22 Bottom reversalm reversalm 15
on volumevolumel
o
RS
20 on R RS line atline at 14 12
new high
n
Shakeout 18 new highhi gh 11
Shakeoutk
c closes uppe er e er 17 16 10 9
closes in uppeoses in uppepe
half of range oof rangegeo
half ono on 15 Big me 8
mee
Big volumvolumv
heavy e 14 13 cluesl es 7
heavy volumeyyvyvy
heavy volumevolumem
12 © 2009 Investor’s Business Daily, Inc. 6 © 2009 Investor’s Business Daily, Inc.
11 5
Volume 2/1
8,000,000 Volume
5,000,000 1,600,000
3,000,000 800,000
400,000
1,800,000 200,000
Sep 1998 Dec 199 8 Mar 1999 Jun 1999 Oct 1998 Dec 1998 Mar 1999 Jun 1999
Checkpoint Software 1104% increase in 40 weeks RF Micro Devices 444% increase in 36 weeks
Buy pointpp
Buy point Price Price
Broadvision P Priorrior 78 72 E-Tek Dynamics B Buy pointto 54 52
Buy point
B Buy point
nd
Weekly Chart uptrenpptrenn nd d d 66 Weekly Chart 50
60 48 46
54
50 44
46 P P orrioio 42
42 40
upt
39 upt ptrendtrendt trendd 38
36
33 36
30 34
27 25 32
li
RSS
RS line aea at at 23 30
g
w
neww
new w highhigh 21 28
19 27
Big volumv volumm me 18 16 26 25
Big vv
me
IPO
cu s s s 15 IPO O O V V V V V lolumeolume 24
cluesesl
13 * * d d drry-upyup 23 22
12
eouts clocloc
Shakee
S S S
se
11 Shake eouts see in inn handlhandl le le 21
10 © 2009 Investor’s Business Daily, Inc. © 2009 Investor’s Business Daily, Inc.
near p
p p peak
n n n
9 near pp peak 19
Volume Volume
3,000,000 3,000,000
1,400,000 1,400,000
600,000 600,000
200,000 200,000
Dec 1998 Mar 1999 Jun 1999 Sep 1999 Dec 1998 Mar 1999 Jun 1999 Sep 1999
Broadvision 823% increase in 30 weeks E-Tek Dynamics 507% increase in 28 weeks
B
Buy point
Buy pointo
Siebel Systems B Buy pointo Price Business Obj Buy point Price
68
50
64 46
Weekly Chart 60 Weekly Chart 42
56 39
52 36 33
P P ioriorrrri 48 30
ptrend
upppp p p p ptrend 45 P Priorrior 27
trenddddd
42 uptrend d d 25
uptrendn
39 23
37 21
35 19
33 18
31 16
29 15
RS line atline t t at 27 RS line a at ata 13
RS
RS lineS
new highhighw
new
new highhighw g 25 new g 12 11
23 10
21
Shakeout closesclosesstk
19 Shakeout si s inn 9
g
B Big
Bigg g volumvolumu e e 18 upper half of ranpper half of rannlle ge 8
ge
ue
c cu
clulu ue 17 16 © 2009 Investor’s Business Daily, Inc. on heavy volumeheavy volumemh e e 7 © 2009 Investor’s Business Daily, Inc.
on
15 6
Volume Volume
8,000,000
5,000,000 1,180,000
3,000,000 660,000
360,000
1,800,000 200,000
Dec 1998 Mar 1999 Jun 1999 Sep 1999 Dec 1998 Mar 1999 Jun 1999 Sep 1999
Siebel Systems 466% increase in 28 weeks Business Objects 480% increase in 26 weeks