
Page 449 - How to Make Money in Stocks Trilogy
P. 449
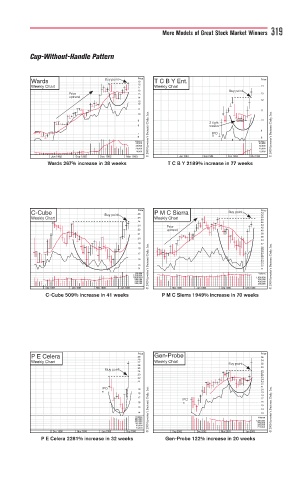
More Models of Great Stock Market Winners 319


          Cup-Without-Handle Pattern


                               uy point
          Wards               Buu uy pointo  Price  T C B Y Ent.         Price
                                       19
          Weekly Chart                 18 17  Weekly Chart               14
                                       16                       Buy pointyy
                                                                Buy point
                    P P ororriorioo    15                                13
                    uptt
                      rend
                    upt rend d d       14
                                       13                                12
                                       12
                                       11                                11
                                       10
                                       9                   3 tight       10
                                                           3
                                       8                   weeks
                                                           w
                                       7  © 2009 Investor’s Business Daily, Inc.  IPO O  9 © 2009 Investor’s Business Daily, Inc.
                                       6                   *             8
                                      Volume                     3/2    Volume
                                       40,000                           40,000
                                       30,000                           30,000
                                       20,000                           20,000
                                       10,000                           10,000
                Jun 1982  Sep 1982  Dec 1982  Mar 1983  Jun 1984  Sep 1984  Dec 1984  Mar 1985
               Wards 267% increase in 38 weeks  T C B Y 2189% increase in 77 weeks
                                       Price                             Price
                                                                B
                                                                Buy pointpo tp
          C-Cube              Buy pointtyy  26  P M C Sierra    Buy pointuy po tpuy  54 52
                              Buy pointpoint
                              B Buy
          Weekly Chart                 25   Weekly Chart                 50 48
                                       24                                46
                                       23                                44
                                               P P orriii                42
                                               up
                                       22      upt trend d d             40
                                                trend
                                       21                                38
                                                                         36
                                       20
                                                                         34
                                       19                                32
                                       18                                30 29
                                       17                                28 27 26
                                       16                                25 24
                                       15 © 2009 Investor’s Business Daily, Inc.  23 22 © 2009 Investor’s Business Daily, Inc.
                                       14                                21
                                      Volume                            Volume
                                      1,700,000
                                      1,000,00 0                       1,600,000
                                      580,000                           800,000
                                      340,000                           400,000
                                      200,000                           200,000
              Sep 1994  Dec 1994  Mar 1995  Jun 1995  Mar 1998  Jun 1998  Sep 1998  Dec 1998
              C-Cube 509% increase in 41 weeks  P M C Sierra 1949% increase in 70 weeks
                                       Price                             Price
          P E Celera                   29   Gen-Probe                    36
          Weekly Chart                 28 27  Weekly Chart               34
                                                                B
                                                                Buy point
                                                                Buy pointtppointp
                                       26                       Buy      32
                              Buy pointpointn
                              Buy pointtyuy  25                          30
                              Buy
                                       24                                28
                                                                         27
                                       23                                26
                                       22                                25
                                                                         24
                                       21                                23
                                                                         22
                             IPO O     19                                21 20
                             *         18                                19
                                       17          I IPOPOO O O O        18 17
                                       16          * *                   16
                                       15 © 2009 Investor’s Business Daily, Inc.  15 14 © 2009 Investor’s Business Daily, Inc.
                                       14                                13
                                      Volume                            Volume
                                      960,000
                                      400,000                          1,440,000
                                      160,000                           780,000
                                       60,000                           420,000
                                       20,000                           220,000
                Dec 1998  Mar 1999  Jun 1999  Sep 1999  Sep 2002  Dec 2002  Mar 2003  Jun 2003
             P E Celera 2281% increase in 32 weeks  Gen-Probe 122% increase in 20 weeks