
Page 446 - How to Make Money in Stocks Trilogy
P. 446
316 INVESTING LIKE A PROFESSIONAL
Reebok Buy point Price Compaq Price
19
Buy pointtppointp
Buy
31
Weekly Chart 30 Weekly Chart Buy y y pointtpointn 18
Buyy
y y y point
29
28 17
27 P Prior
p
p ptrend
up ptrend 16
26
25 15
24
IPOP O 23 14
* V V lolumeu
22 dry-up onu back n 13
pullbb
pullb
back
Shakeout 21
S S Shakeout
c closes in 12
Strong up weeup wweewg eks u upper half pper half 20 © 2009 Investor’s Business Daily, Inc. © 2009 Investor’s Business Daily, Inc.
eks
S
Strong
on big volumebigg
o on g g volummem 19 11
of rangegf of range
Volume
Volume 1,700,000
300,000 1,000,000
140,000 580,000
60,000 340,000
20,000 200,000
Jun 1985 Sep 1985 Dec 1985 Mar 1986 Mar 1986 Jun 1986 Sep 1986 Dec 1986
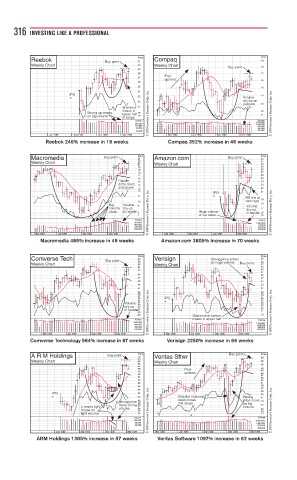
Reebok 246% increase in 18 weeks Compaq 352% increase in 46 weeks
Macromedia Buu uy pointyp Price Amazon.com Buy pointpp Price
Buy point
B
uy pointi
24
32
Weekly Chart 23 22 31
21 Weekly Chart 30 29
20
19 28
18 27
17 26
16 25
Handlea 15 24
driffts down n 14 23
along lowso ong lowsg 13 22
12 IPO O O 21
IPO
11 * RS line a at
10 new highhi gh 19
Big
Big V Volumeolume 9 Volume 18
volumu me dry-up d dry-up 17
g
cluese in handl le 8 © 2009 Investor’s Business Daily, Inc. Huggg ge vol um me in in handlhandl le le 16 © 2009 Investor’s Business Daily, Inc.
on uuu
eek
eek
up
p
7 on up wewee eekk 15
Volume Volume
920,000 1,440,000
560,000 780,000
340,000 420,000
200,000 220,000
Mar 1994 Jun 1994 Sep 1994 Dec 1994 Dec 1996 Mar 1997 Jun 1997 Sep 1997
Macromedia 486% increase in 49 weeks Amazon.com 3805% increase in 70 weeks
Comverse Tech B B B uy po ointtit Price Verisign St Stt rong ppp rice actioactioe actioa on Price
rice
52
onn
rong
60
ypointo
yp
m
me
n huge u
onn
Buy pypp
Weekly Chart 58 56 Weekly Chart on nh g volumvoluumge me Buy pointp p point t t 49 47
54 45
52 43
41
49 39
47 37
45 35
43 33
41 31
39 29
38 28
37 27
I
IPO
36 IPO O O 26
35 25
V Volumeolume 34 33 * * * * * 24
d d drry-upyup 32 23 22
in in handlhandl le le 33 31 21
30 © 2009 Investor’s Business Daily, Inc. © 2009 Investor’s Business Daily, Inc.
29 Shaaa akeoutt ta ottomo ottom 19
t at botbo
Sha
akeout
clos
ses in in
Volume clo ses uppeppee r r halfhalf Volume
1,600,000 1,140,000
800,000 640,000
400,000 360,000
200,000 200,000
Mar 1998 Jun 1998 Sep 1998 Dec 1998 Mar 1998 Jun 1998 Sep 1998 Dec 1998
Comverse Technology 564% increase in 67 weeks Verisign 2250% increase in 66 weeks
Buy point
A R M Holdings Buy pointt Price Veritas Sftwr Buy pointpp Price
Buy pointypyy
70
66
Weekly Chart 68 66 Weekly Chart 62
64 58
62
60 P P P P P P P P Priorrioririor 54 52
58
uptrendd
56 u u u uptrend d d 49 47
54 45
52 43
50 41
48 39 37
46 35
IP IPP O O O O 44 33
S S S
Stro
ng
* * 42 Massive shaas akeouu ut S S Stron ng 31
w
week closes sk
e moveo
p p p
priceee
e
Stron
Stronn
So ng 40 39 mid range rara pc bigg e ee 29
ng price gp ceprice
S S S S S S S S S
on bb
o o
mid-range
e on big nbig
movee
m m m move eo 38 27
gh
4 4 weeweee eks gh ht ht v vo oluml olumm me 37 36 volum me 25
v v v
eks tigtigg
me
volu
me
close s onn 35 © 2009 Investor’s Business Daily, Inc. 24 © 2009 Investor’s Business Daily, Inc.
so
closees
volumm
mee
me
light volum me 34 3/2 23
g light vvv
Volume Volume
160,000 4,000,000
80,000 1,400,000
40,000 600,000
200,000
Jun 1998 Sep 1998 Dec 1998 Mar 1999 Mar 1998 Jun 1998 Sep 1998 Dec 1998 Mar 1999
ARM Holdings 1385% increase in 57 weeks Veritas Software 1097% increase in 62 weeks