Page 535 - How to Make Money in Stocks Trilogy
P. 535

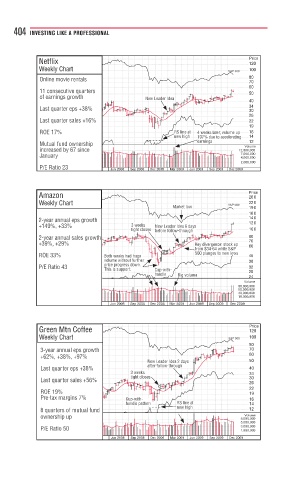
404  INVESTING LIKE A PROFESSIONAL


            Netflix                                                  Price
                                                                     120
            Weekly Chart                                        S&P 500  100
            Online movie rentals                                     80
                                                                     70
                                                                     60
            11 consecutive quarters                                  50
            of earnings growth           New Leader IdeaLeade  a
                                                                     40
            Last quarter eps +38%                                    34
                                                                     30
                                                                     26
            Last quarter sales +16%                                  22
                                                                     19
            ROE 17%                              RS line atline atai  4 4 weeks lateweeks lateaew  r r, volume upvolume up  16
                                                             r r r
                                                 RS
                                                 R
                                                 new highhigh
                                                 n new  g  197% due to acceleratingdue to acceleratingee to a%9  g g  14
                                                       197%
                                                       ea eaarrningsningsn  12
            Mutual fund ownership                                   Volume
            increased by 67 since                                  12,000,000
            January                                                7,000,000
                                                                   4,000,000
                                                                   2,000,000
            P/E Ratio 23        Jun 2008  Sep 2008  Dec 2008  Mar 2009  Jun 2009  Sep 2009  Dec 2009
            Amazon                                                   Price
                                                                     260
            Weekly Chart                                        S&P 500  220
                                                 M
                                                 Market low w w      190
                                                 Market lowket lo
                                                                     160
            2-year annual eps growth                                 140
                                                                     120
                                     3
            +149%, +33%              3 weekskkw  New Leader Idea 6 daysyr Idea
                                            New
                                     tightg g g tight closesclosesec  before follofollof  w w w-throughthroughuh  100
                                            before
                                            befo
            2-year annual sales growth                               80
            +39%, +29%                                 Key divergence: stock up y vyyyy  ge g g  e: sto  p  70
                                                       f from $34-64 while S&P$34 64 hil S&Pwhile43m  60
            ROE 33%           Both weeks had huge weeks had hugead hswot  500 plunges to new lows newsu0  p  g  45
                              Both
                              volume without fuut futml  rthee r     38
            P/E Ratio 43      price progress down. s doressp         32
                              Thi
                              This is suppois  p p pp rrt.t  C C Cup-with-p-  i ht
                                            h hd  Big volumegg g g g o  m  28
                                            handleld
                                                                     24
                                                                    Volume
                                                                  80,000,000
                                                                  50,000,000
                                                                  30,000,000
                                                                  18,000,000
                                Jun 2008  Sep 2008  Dec 2008  Mar 2009  Jun 2009  Sep 2009  Dec 2009
            Green Mtn Coffee                                         Price
                                                                     120
            Weekly Chart                                        S&P 500  100
                                                                     80
             3-year annual eps growth                                70
             +62%, +38%, +97%                                        60
                                          N
                                          New Leader Idea 2 daysLeader Idea 2 dayssa 2 dLea  50
                                          New
                                          a after follofollow-throughugh-
             Last quarter eps +38%                                   40
                                     3 weeks kw                      34
                                      g g g g g tight closesc osese  30
             Last quarter sales +56%
                                                                     26
                                                                     22
             ROE 19%                                                 19
             Pre-tax margins 7%     Cup  ith                         16
                                    C Cup-with-with-up-wu
                                    handle pattela  ppatteat rrrnn  RS line atSS  e  14
                                    handle
                                                  new highiw  g
             8 quarters of mutual fund                               12
                                                                    Volume
             ownership up                                          8,000,000
                                                                   5,000,000
                                                                   3,000,000
             P/E Ratio 50                                          1,800,000
                                Jun 2008  Sep 2008  Dec 2008  Mar 2009  Jun 2009  Sep 2009  Dec 2009
   530   531   532   533   534   535   536   537   538   539   540