
Page 537 - How to Make Money in Stocks Trilogy
P. 537
406 INVESTING LIKE A PROFESSIONAL
Price
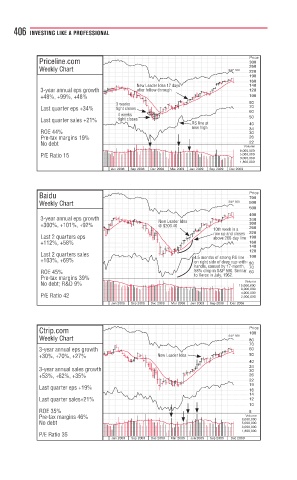
Priceline.com 300
Weekly Chart S&P 500 260
220
190
160
Neww LeaderLeadereader IdeaIdeae 1717 daysdaysa s s 140
New
3-year annual eps growth a affter folloter follooe w w w-throughthroughgr 120
+48%, +99%, +48% 100
3 3 weeks weekseeks 80
Last quarter eps +34% tight closesclosesst clo 70
g
tight
60
4 weeksweek
Last quarter sales +21% ti g tight closesht l eht c 50
RS line attn 40
RS line at
R
new highgh g g 34
ROE 44% 30
Pre-tax margins 19% 26
No debt 22
Volume
8,000,000
P/E Ratio 15 5,000,000
3,000,000
1,800,000
Jun 2008 Sep 2008 Dec 2008 Mar 2009 Jun 2009 Sep 2009 Dec 2009
Baidu Price
700
Weekly Chart S&P 500 600
500
400
3-year annual eps growth New 340
New Leader Idea Leader Ideaer IdLe
+300%, +101%, +92% @ $200.40$200 4000 300
@
10th
10th week in aweek in a wee 260
row up and closes up and closesup ao
row 220
Last 2 quarters eps above y line 190
a
above 200-day line200-dayve 20
+112%, +58% 160
140
120
Last 2 quarterssales 4 4.5 months of strong RS line 5 months of strong RS linenof snm 100
+103%, +69% on right side of deep cup-with-g ti e of p e p - 80
handle, caused by 17-month, month, 1sedd
handle, caused by 17 70
ROE 45% 58% drop in S&P 500. Similarp n S&o% y y y y, 1962.9, 5 60
to Xerox in JulJxe
Pre-tax margins 39%
Volume
No debt; R&D 9% 15,000,000
8,000,000
4,000,000
P/E Ratio 42 2,000,000
Jun 2008 Sep 2008 Dec 2008 Mar 2009 Jun 2009 Sep 2009 Dec 2009
Ctrip.com Price
100
Weekly Chart S&P 500 80
70
3 3-year annual eps growth 60
New
+ +30%, +70%, +27% New Leader IdeaLeader Ideaer IdLe 50
40
3 3-year annual sales growth-year annual sales growth 34
30
+ +53%, +62%, +35% 26
22
19
L Last quarter eps +19%
16
14
L Last quarter sales+21% 12
10
R ROE 35% 8
Volume
P Pre-tax margins 46% 8,000,000
N No debt 5,000,000
3,000,000
1,800,000
P P/E Ratio 35
Jun 2008 Sep 2008 Dec 2008 Mar 2009 Jun 2009 Sep 2009 Dec 2009