
Page 538 - How to Make Money in Stocks Trilogy
P. 538
Institutional Portfolio Ideas 407
Price
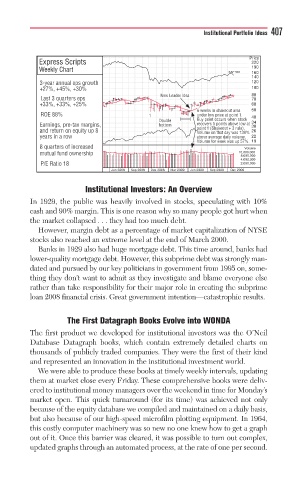
Express Scripts 220
Weekly Chart 190
S&P 500 160
140
3 3-year annual eps growth 120
+ +27%, +45%, +30% 100
New Leader IdeaLeader Ideaader 80
N
New
Last 3 quarters eps 70
+ +33%, +33%, +25% 60
6 6 weeks in shakeout areaweeks in shakeout areaakeokw 50
ROE 88% 1 under low price at point 1.ce atd 40
B
Doubleo Buy point occurs when stocki t occuoy urs w h t k
recovers
E Earnings, pre-tax margins , bottommo recovers 5 points above low at5 points above lowpoiec 3 rrule).ule) t at 34
b
30
point
point 1 (Shakeout + 3 1 (Shakeoutthake1i
point 1 (Shakeout + 3
a and return on equity up 8 V V Volume on that day was 139%olume on that day was 139%a thaml 26
y years in a row above 22
above average daily volume.average daily volumeirageo
V Volume for week was up 57%.olume for week was up 57%wr weml 19
8 8quartersof increased Volume
m mutual fund ownership 15,000,000
8,000,000
4,000,000
P/E Ratio 18 2,000,000
Jun 2008 Sep 2008 Dec 2008 Mar 2009 Jun 2009 Sep 2009 Dec 2009
Institutional Investors: An Overview
In 1929, the public was heavily involved in stocks, speculating with 10%
cash and 90% margin. This is one reason why so many people got hurt when
the market collapsed . . . they had too much debt.
However, margin debt as a percentage of market capitalization of NYSE
stocks also reached an extreme level at the end of March 2000.
Banks in 1929 also had huge mortgage debt. This time around, banks had
lower-quality mortgage debt. However, this subprime debt was strongly man-
dated and pursued by our key politicians in government from 1995 on, some-
thing they don’t want to admit as they investigate and blame everyone else
rather than take responsibility for their major role in creating the subprime
loan 2008 financial crisis. Great government intention—catastrophic results.
The First Datagraph Books Evolve into WONDA
The first product we developed for institutional investors was the O’Neil
Database Datagraph books, which contain extremely detailed charts on
thousands of publicly traded companies. They were the first of their kind
and represented an innovation in the institutional investment world.
We were able to produce these books at timely weekly intervals, updating
them at market close every Friday. These comprehensive books were deliv-
ered to institutional money managers over the weekend in time for Monday’s
market open. This quick turnaround (for its time) was achieved not only
because of the equity database we compiled and maintained on a daily basis,
but also because of our high-speed microfilm plotting equipment. In 1964,
this costly computer machinery was so new no one knew how to get a graph
out of it. Once this barrier was cleared, it was possible to turn out complex,
updated graphs through an automated process, at the rate of one per second.