
Page 536 - How to Make Money in Stocks Trilogy
P. 536
Institutional Portfolio Ideas 405
Price
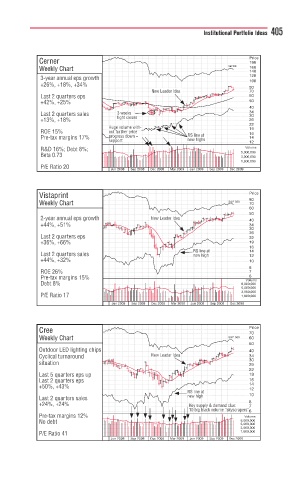
Cerner 190
Weekly Chart S&P 500 160
140
120
3-year annual eps growth
100
+26%, +18%, +34%
80
New 70
New Leader IdeaLeader Ideaddew L
Last 2 quarters eps 60
+42%, +25% 50
40
Last 2 quarterssales 3 weeksweekskw 34
3
30
+13%, +18% ti g tight closesht lloseh s 26
22
H
Huge volume with-gg olum w
ROE 15% o out fut furrther price cherther price 19
16
RS
RS l
progress down =ds dog
pg
Pre-tax margins 17% p progres RS line atline ata 14
new
s suppop p pp new highshi ghh 12
pp rt
R&D 16%; Debt 8%; Volume
Beta 0.73 5,000,000
3,000,000
1,800,000
/ P/E Ratio 20
Jun 2008 Sep 2008 Dec 2008 Mar 2009 Jun 2009 Sep 2009 Dec 2009
Vistaprint Price
Weekly Chart S&P 500 80
70
60
50
2-year annual eps growth New Leader Ideadew Le a 40
+44%, +51% 34
30
26
Last 2 quarters eps 22
+36%, +66% 19
16
RS 14
RS lin
RS line at line ata
Last 2 quarterssales new highhigh 12
gh
new h
new
+44%, +32% 10
8
ROE 26% 7
6
Pre-tax margins 15% Volume
Debt 8% 8,000,000
5,000,000
3,000,000
P/E Ratio 17 1,800,000
Jun 2008 Sep 2008 Dec 2008 Mar 2009 Jun 2009 Sep 2009 Dec 2009
Cree Price
70
Weekly Chart S&P 500 60
50
O Outdoor LED lighting chips s 40
New Leader Ideadw L
C Cyclical turnaround New Leader Idea a a 34
s situation 30
26
22
L Last 5 quarters eps up 19
L Last 2 quarters eps 16
+ +50%, +43% 14
12
RS line at liline a
R
RS 10
new highhighw high
n
L Last 2 quarterssales new g g
+ +24%, +24% K Key supply & demand clue:ey supply & demand clue:emayy sup 8 7
10 big black volume “skyscrapers”gbig b y p 6
10 big black volume “skyscrapers”solumc
P Pre-tax margins 12% Volume
N No debt 8,000,000
5,000,000
3,000,000
P P/E Ratio 41 1,800,000
Jun 2008 Sep 2008 Dec 2008 Mar 2009 Jun 2009 Sep 2009 Dec 2009