
Page 88 - How to Make Money in Stocks Trilogy
P. 88
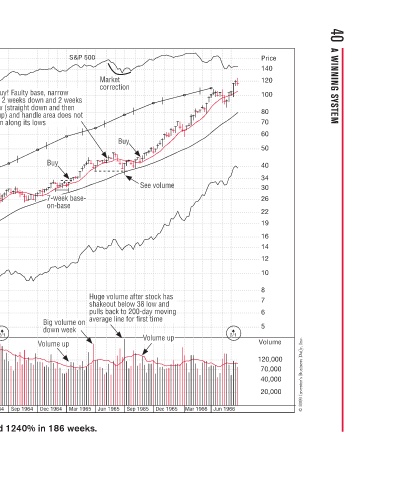
40  A WINNING SYSTEM


           Price  140  120  100  80  70  60  50  40  34  30  26  22  19  16  14  12  10  8  7  6  5  Volume  120,000  70,000  40,000  20,000  © 2009 Investor’s Business Daily, Inc.


                                                         2/1
                                                                     Jun 1966
                                                                     Mar 1966


                                See volume  e  e  u  v  e  h  o  t  d  n  w  38 l  day moving  g  v  d  0  s  Volume up  p Volume up  e  u  V  Dec 1965 Sep 1965


               Market  Market  e  a  correction  o  o  ec  c  co  Buy  y  u  Huge volume after stock has   u  v shakeout below 38 low and  bl  e  t  o  hk pulls back to 200-day moving pulls back to 200  o  b average line for first time  g  Jun 1965
           S&P 500  s  k  t t t  o  s              u  h  u  v  n     Mar 1965

                 Do Not Buy! Faulty base, narrow Do Not Buy! Faulty base, narrow  s v-shaped 2 weeks down and 2 weeks  w  w  s up off low (straight down and then  o  s straight up) and handle area does not  dl  d h  )  ht  i dri ift down along its lows drift down along its lows  w  2/1  V  Sep 1964 Jun 1964 Northwe
                 w  r  n  w  a  h  d  e  d  d  r  y  y  Buy  y  y  y  B  7-week base- week base  k  7-we  7-we  w  7  7  7  on-base  s  b  o  Big volume on  v  k down week  e  n  do  p Volume up  e  u  Dec 1964


                     tr
                   p
                 o
                                              Buy: pullback to Buy: pullback to  c  10-week moving   o  average line  Volume up  Mar 1964 Dec 1963
            s
            jet planes
            New product: jet planes  p  ct  od  o  p and new route to Japan and new route to Japan  J  w  Market  Market  k  correction  o  ec  e  e  co  u  0  v  Add: pullbacks to  a  10-week moving week moving  m  e average line  g  g  g  Sep 1963 Jun 1963
             n
             n
            s
            Ne
                                                   10
                                                  A
                                                     a
                                                                     Mar 1963 Dec 1962
                                Do Not Buy! Stock is
                                 ht u
           Northwest Airlines–1962  Weekly Chart  1962 bear market 1962 bear market  1  Do Not Buy! Stock is  B  B  extended straight up  d  d  td  from 8 to 14 and it s from 8 to 14 and it’s  o  a third stage base a third stage base  t t  Buy  y  u  Huge volume demand  e  Volume up  u  Sep 1962 Jun 1962
                                  t
                                 i
                                 t


          Price =  20*eps   7.00   6.50   6.00   5.50   5.00    4.50   4.00   3.50   3.00   2.50   2.25   2.00   1.80   1.60   1.50    1.40    1.30    1.20   1.10    1.00   0.90    0.80    0.75    0.70    0.65    0.60    0.55    0.50    0.45    0.40    0.35    0.30    0.25   Mar 1962