
Page 92 - How to Make Money in Stocks Trilogy
P. 92
42 A WINNING SYSTEM
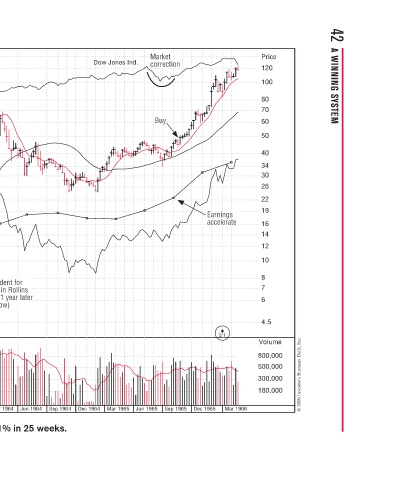
Price 120 100 80 70 60 50 40 34 30 26 22 19 16 14 12 10 8 7 6 4.5 Volume 800,000 500,000 300,000 180,000 © 2009 Investor’s Business Daily, Inc.
s t Mar 1966
Earnings a accelerate accelerate e 2/1
Dec 1965
c
Market Market k M correction o o o ec e re co Buy y Buy u Sep 1965 Jun 1965
Dow Jones Ind. Mar 1965
Dec 1964
Sep 1964
r r Jun 1964
Became precedent for high tight flag in Rollins high tight flag in Rollins that appeared 1 year late y Mar 1964
o
t t r f r pp (see chart below) 3/1 Syntex increased 451% in 25 weeks.
Sell: climax top Sell: climax top m d d d 4 4 High tight High tight flag base B h t ( Huge earnings s i Dec 1963 Sep 1963
e e Syntex was on th s ed e s s s oc Market M M orrection orrection o ec o o co c c Syntex doubled on a when issued Syntex doubled on a when issue h e 3 for 1 new stock run-up from 44 u t to over 90 on this chart t n s Buy y y H growth growth go g g Jun 1963
New product “The Pill,” Syntex was on the S The Pill T New product p American Stock Exchange when they liste e k i a number of different growth stocks gow ee f d o be um n o o Stock prices adjusted for 3/1 Stock prices adjusted for 3/1 s t and 2/1 stock splits. Syntex was S c n ac
Syntex–1963 a Weekly Chart Jun 1962 Mar 1962 Dec 1961
Price = 20*eps 6.00 5.50 5.00 4.50 4.00 3.50 3.00 2.50 2.25 2.00 1.80 1.60 1.50 1.40 1.30 1.20 1.10 1.00 0.90 0.80 0.75 0.70 0.65 0.60 0.55 0.50 0.45 0.40 0.35 0.30 0.25 0.23 0.20