
Page 90 - How to Make Money in Stocks Trilogy
P. 90
America’s Greatest Stock-Picking Secrets 41
Price 340 300 260 220 190 160 140 120 100 80 70 60 45 38 32 28 24 20 17 15 13 Volume 350,000 150,000 70,000 30,000 © 2009 Investor’s Business Daily, Inc.
Sep 1966
Jun 1966
Mar 1966
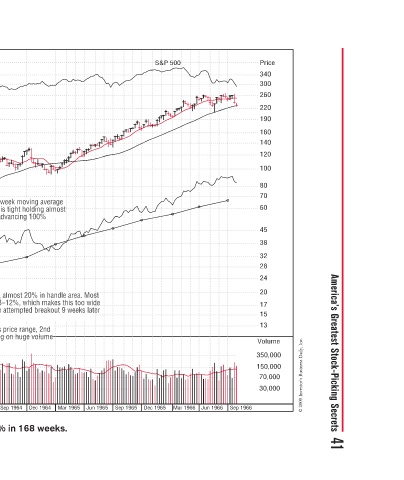
S&P 500 Dec 1965
Sep 1965
st t s M e dl n de de d o t h e er e s e u Jun 1965 Mar 1965
st
st
pullback to 10-week moving average v - ne and whole base is tight holding almos and whole base is tight holding almos o e all of its gain since advancing 100% all of its gain since advancing 100% a a Stock just corrected 32 to 26, almost 20% in handle area. Mos h t 20% i
e
m
a
Add: pull b pull w ine a line a line g g a Add: pullback to 10-week w c moving average line g average line g r d 32 t d t t s k j normal handles correct only 8 r a e 1962 in December 1962 b m Huge volume support: 1st red week closes in upper half of we
moving
Add:
Add:
o
3 more tight 3 more tight t 3m 3m closing weeks g o St D k t red week huge volume but gives up small amount u Sep 1963
d
d
m
Buy s B 12-week cup-with-handle i p- cup- p- p p cup -w r marke u v v e Jun 1963 Mar 1963
3 weeks 3 tight closes g i along lows e ndle similar to 44-week cup- 68-week cup-with-handle similar to 44-week cup 44 milar ndle sim m with-handle Xerox formed in 1957 bear market n 1957 bear market n 1957 bear mark Hug Hug Dec 1962 Sep 1962
e
Xerox–1963 Weekly Chart 1962 bear market creates 1962 bear market creates r 2 the Xerox base e X Do Not Buy! Straight Do Not Buy! Straight a up from 17.5 to 32, 3 m too obvious and v market is correcting market is correcting t h p c ndle Xerox for f d n Jun 1962
Price = 20*eps 18 16 15 14 13 12 11 10 9.00 8.00 7.50 7.00 6.50 6.00 5.50 5.00 4.50 4.00 3.50 3.00 2.50 2.25 2.00 1.80 1.60 1.50 1.40 1.30 1.20 1.10 1.00 0.90 0.80 0.75 0.70 0.65