
Page 38 - TI Journal 18-1
P. 38
32 ZHANG
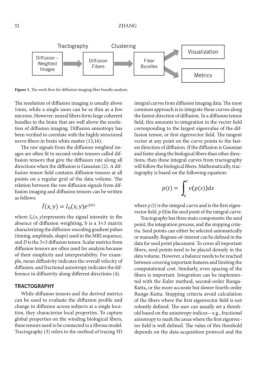
Tractography Clustering
Visualization
Diffusion –
Weighted Diffusion Fiber
Images Fibers Bundles
Metrics
Figure 1. The work flow for diffusion imaging fiber bundle analysis.
The resolution of diffusion imaging is usually above integral curves from diffusion imaging data. The most
1mm, while a single axon can be as thin as a few common approach is to integrate these curves along
microns. However, neural fibers form large coherent the fastest direction of diffusion. In a diffusion tensor
bundles in the brain that are well above the resolu- field, this amounts to integration in the vector field
tion of diffusion imaging. Diffusion anisotropy has corresponding to the largest eigenvalue of the dif-
been verified to correlate with the highly structured fusion tensor, or first eigenvector field. The tangent
nerve fibers in brain white matter (13,16). vector at any point on the curve points to the fast-
The raw signals from the diffusion weighted im- est direction of diffusion. If the diffusion is Gaussian
ages are often fit to second-order tensors called dif- and faster along the biological fibers than other direc-
fusion tensors that give the diffusion rate along all tions, then these integral curves from tractography
directions when the diffusion is Gaussian (2). A dif- will follow the biological fibers. Mathematically, trac-
fusion tensor field contains diffusion tensors at all tography is based on the following equation:
points on a regular grid of the data volume. The
relation between the raw diffusion signals from dif-
�
fusion imaging and diffusion tensors can be written () = �()�
as follows: ₀
~ where p (t) is the integral curve and is the first eigen-
(, ) = ₀(, ) ()
vector field. p (0)is the seed point of the integral curve.
where I 0 (x, y)represents the signal intensity in the Tractography has three main components: the seed
absence of diffusion weighting, b is a 3×3 matrix point, the integration process, and the stopping crite-
characterizing the diffusion-encoding gradient pulses ria. Seed points can either be selected automatically
(timing, amplitude, shape) used in the MRI sequence, or manually. Regions-of-interest can be defined in the
and D is the 3×3 diffusion tensor. Scalar metrics from data for seed point placement. To cover all important
diffusion tensors are often used for analysis because fibers, seed points need to be placed densely in the
of their simplicity and interpretability. For exam- data volume. However, a balance needs to be reached
ple, mean diffusivity indicates the overall velocity of between covering important features and limiting the
diffusion, and fractional anisotropy indicates the dif- computational cost. Similarly, even spacing of the
ference in diffusivity along different directions (4). fibers is important. Integration can be implemen-
ted with the Euler method, second-order Runga-
TRACTOGRAPHY Kutta, or the more accurate but slower fourth-order
While diffusion tensors and the derived metrics Runge-Kutta. Stopping criteria avoid calculation
can be used to evaluate the diffusion profile and of the fibers where the first eigenvector field is not
change in diffusion across subjects at a single loca- robustly defined. The user can usually set a thresh-
tion, they characterize local properties. To capture old based on the anisotropy indices—e.g., fractional
global properties on the winding biological fibers, anisotropy to mark the areas where the first eigenvec-
these tensors need to be connected to a fibrous model. tor field is well defined. The value of this threshold
Tractography (3) refers to the method of tracing 3D depends on the data-acquisition protocol and the