
Page 40 - TI Journal 18-1
P. 40
34 ZHANG
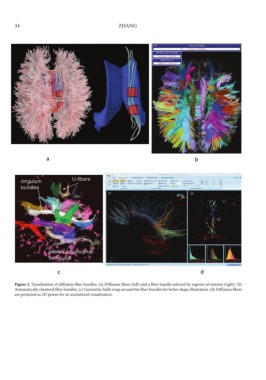
Figure 2. Visualization of diffusion fiber bundles. (a) Diffusion fibers (left) and a fiber bundle selected by regions-of-interest (right). (b)
Automatically clustered fiber bundles. (c) Geometric hulls wrap around the fiber bundles for better shape illustration. (d) Diffusion fibers
are projected as 2D points for an uncluttered visualization.