
Page 73 - T-I JOURNAL19 4
P. 73
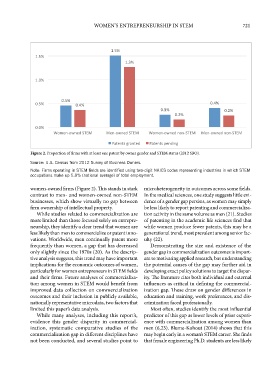
Figure 2. Proportion of firms with at least one patent by owner gender and STEM status (2012
              SBO).                  WOMEN’S ENTREPRENEURSHIP IN STEM                        721


                                           1.5%
              1.5%
                                                1.3%


              1.0%


                        0.5%
              0.5%            0.4%                                               0.4%
                                                              0.3%                    0.2%
                                                                   0.2%


              0.0%
                     Women-owned STEM    Men-owned STEM   Women-owned non-STEM   Men-owned non-STEM
                                           Patents granted   Patents pending

             Figure 2. Proportion of firms with at least one patent by owner gender and STEM status (2012 SBO).

             Source: U.S. Census estimates from 2012 Survey of Business Owners.
             Source: U.S. Census from 2012 Survey of Business Owners.

             Note: Firms operating in STEM fields are identified using two-digit NAICS codes representing industries in which STEM
             Note: Firms operating in STEM fields are identified using two-digit NAICS codes representing industries in
             occupations make up 5.8% (national average) of total employment.
             which STEM occupations make up 5.8% (national average) of total employment.
             women-owned firms (Figure 2). This stands in stark  microheterogeneity in outcomes across some fields.

             contrast to men- and women-owned non-STEM  In the medical sciences, one study suggests little evi-
             businesses, which show virtually no gap between  dence of a gender gap persists, as women may simply
             firm ownership of intellectual property.   be less likely to report patenting and commercializa-
               While studies related to commercialization are  tion activity in the same volume as men (21). Studies

             more limited than those focused solely on entrepre-  of patenting in the academic life sciences find that
             neurship, they identify a clear trend that women are  while women produce fewer patents, this may be a


             less likely than men to commercialize or patent inno-  generational trend, most prevalent among senior fac-
             vations. Worldwide, men continually patent more  ulty (22).
             frequently than women, a gap that has decreased    Demonstrating the size and existence of the
             only slightly since the 1970s (20). As the descrip-  gender gap in commercialization outcomes is import-
             tive analysis suggests, this trend may have important  ant to motivating applied research, but understanding
             implications for the economic outcomes of women,  the potential causes of the gap may further aid in
             particularly for women entrepreneurs in STEM fields  developing exact policy solutions to target the dispar-
             and their firms. Future analyses of commercializa-  ity. The literature cites both individual and external
             tion among women in STEM would benefit from  influences as critical in defining the commercial-
             improved data collection on commercialization  ization gap. These draw on gender differences in
             outcomes and their inclusion in publicly available,  education and training, work preferences, and dis-
             nationally representative microdata, two factors that  crimination faced professionally.
             limited this paper’s data analysis.          Most often, studies identify the most influential
               While many analyses, including this report’s,   predictor of this gap as lower levels of prior experi-
             evidence this gender disparity in commercial-  ence with commercialization among women than
             ization,  systematic  comparative  studies  of  the  men (6,23). Blume-Kohout (2014) shows that this
             commercialization gap in different disciplines have  may begin early in a woman’s STEM career. She finds  11

             not been conducted, and several studies point to  that female engineering Ph.D. students are less likely