
Page 70 - T-I JOURNAL19 4
P. 70
718 DEMIRALP ET AL. WOMEN’S ENTREPRENEURSHIP IN STEM 719
Table 11. Characteristics of Businesses: Business Performance by Owner Gender and STEM Status (2007 SBO) and commercialization may further explain existing precursors as well as critical outputs of commercial-
gender gaps, as the disparity is quite marked, par- ization behaviors. The findings are additionally robust
Female-owned Male-owned Female-owned Male-owned
STEM STEM non-STEM non-STEM ticularly among women-owned firms in STEM. The to changes in the definition of primary business own-
N 1,360,550 2,761,549 6,681,528 11,708,507 majority of all respondent businesses rely on less than ership. A comparison of the findings to results under
traditional definitions of majority ownership applied
$5,000 in start-up capital, the lowest funding cate-
No. employee (average) 1.1 3.1 1.0 2.7 gory included in the survey questionnaire; however, to 2007 and 2012 SBO data (in analyses not shown)
Payroll ($1000, average) 40.5 135.0 24.7 86.1 women-owned single-owner businesses in STEM are demonstrates that, across the plurality and majority
Receipts ($1000, average) 176.3 574.3 144.4 536.5 most likely to rely on this funding category (Figure owner definitions and survey rounds, characteris-
Number of years in operation 1). Men-owned firms are more likely to use higher tics of business owners and businesses are broadly
Not reported 4.5% 3.4% 6.3% 5.0% levels of start-up funding slightly more often than similar. While variation in owner definition by sur-
Less than 1 13.6% 10.3% 12.7% 9.3% women-owned firms in both STEM and non-STEM vey year introduces some minor changes in the size
1 8.8% 6.9% 8.4% 6.5% firms. At start-up funding levels above $5,000, the of gender and sector disparities along certain indi-
2 to 4 17.6% 15.4% 17.3% 15.1% disparity in funding by gender becomes apparent. cators, trends remain very similar.
5 to 17 32.3% 32.8% 28.6% 30.2% Among STEM and non-STEM men-owned firms,
More than 18 15.0% 25.1% 16.0% 25.9% non-STEM firms are more likely to receive start-up COMMERCIALIZATION AMONG WOMEN-
funding at all higher levels of funding than STEM OWNED STEM BUSINESSES
Source: Authors’ own analysis of 2007 Survey of Business Owners (U.S. Census Bureau)
firms. Among female owners, STEM firms see the Using data from the 2012 Survey of Business
Note: Firms operating in STEM fields are identified using two digit NAICS codes representing industries in which gap in likelihood to receive start-up funding most Owners, the report also examines a firm’s intellec-
STEM occupations make up 5.8% (national average) of total employment. markedly from all other firm owners beginning at tual property ownership as an important indicator
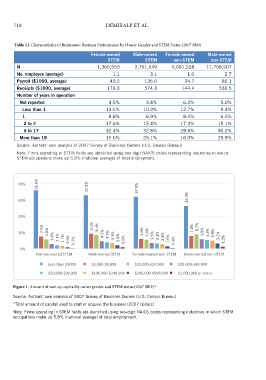
Figure 1. Amount of start-up capital by owner gender and STEM status (2007 SBO). * the $100,000 to $249,999 level, while the gap emerges of commercialization behavior. The analysis takes
prominently for women-owned non-STEM busi- into account the behavior of filing and receiving
40% 36.0% 32.8% 32.0% nesses at the $250,000 to $999,999 funding level. intellectual property as the first critical step in the
Start-up funding sources, to some degree, also
commercialization process, which is followed by the
highlight disparities between men- and wom-
licensing of proprietary innovations. Thus, the anal-
30% 26.3% en-owned businesses. Men-owned businesses, in ysis results presented below characterize the role of
STEM and non-STEM fields, are consistently more gender in a key initial phase of commercialization.
likely to rely on or gain access to a bank loan to fund The commercialization-focused analysis draws
20% start-ups than women-owned businesses (Table 12). on 2012 SBO data and the same approach to identi-
7.5% 9.2% 8.4% 7.8% 8.7% This is notable, as bank loans typically give advan- fying STEM fields by two-digit NAICS codes as the
tages over other personal funding sources, such as one used in analyzing 2007 SBO data. However, to
10% 5.6% 2.8% 2.1% 1.7% 0.9% 0.2% 4.5% 4.0% 3.3% 2.0% 0.9% 5.9% 5.4% 3.5% 3.1% 2.8% 1.6% 0.4% 5.8% 5.3% 4.9% 3.2% 1.2% credit cards or personal loans, in that they are asso- define the gender of firm owner, a Census Bureau
0% ciated with lower interest rates and lower personal classification that identifies the owner as an indi-
financial risk. Expansion capital sources further high-
vidual holding at least 51% of the firm is adopted. In
Female-owned STEM Male-owned STEM Female-owned non-STEM Male-owned non-STEM
light the gender disparity in access to bank loans, as firms where no individual majority owner is identi-
Less than $5000 $5,000-$9,999 $10,000-$24,999 $25,000-$49,999 men-owned firms, in STEM and non-STEM fields, fiable, firms are classified as equal-ownership. SBO
use bank loans to finance expansion at more than data further identifies firms that hold at least one
$50,000-$99,999 $100,000-$249,999 $250,000-$999,999 $1,000,000 or more twice the rate of women-owned firms. Men-owned piece of a type of intellectual property (e.g., trade-
Source: Authors’ own analysis of 2007 Survey of Business Owners (U.S. Census Bureau) firms in both STEM and non-STEM fields are addi- mark, patent) but does not provide information on
Figure 1. Amount of start-up capital by owner gender and STEM status (2007 SBO).* tionally more likely to use business profits to fund the intensity of intellectual property production (e.g.,
Source: Authors’ own analysis of 2007 Survey of Business Owners (U.S. Census Bureau) expansion than women-owned firms; however, STEM number of patents held by a single firm.) Table 13
* Total amount of capital used to start or acquire the business (2007 dollars)
*Total amount of capital used to start or acquire the business (2007 dollars) firms, broadly, are more likely to use business prof- summarizes the trends in intellectual property out-
its to expand than non-STEM firms.
puts of STEM and non-STEM firms.
Note: Firms operating in STEM fields are identified using two-digit NAICS codes representing
Note: Firms operating in STEM fields are identified using two-digit NAICS codes representing industries in which STEM The analyses presented here, while descriptive, In all measures of commercial licensing (e.g.,
occupations make up 5.8% (national average) of total employment. yield insights that support findings from the litera- patenting, trademarking, copyrighting) a distinct
industries in which STEM occupations make up 5.8% (national average) of total employment.
ture, which identify a significant gender gap among gender gap exists among STEM firms. Accordingly,
factors influencing participation in STEM educa- men-owned firms are significantly more likely to
tion and entrepreneurship and experience-based hold at least one piece of intellectual property than
8