
Page 69 - T-I JOURNAL19 4
P. 69
WOMEN’S ENTREPRENEURSHIP IN STEM 717
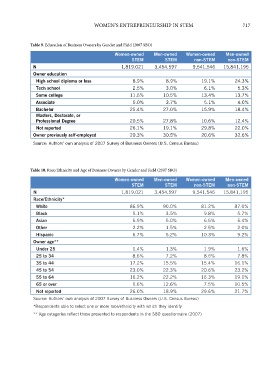
Table 9. Education of Business Owners by Gender and Field (2007 SBO)
Women-owned Men-owned Women-owned Men-owned
STEM STEM non-STEM non-STEM
N 1,819,021 3,454,597 9,541,546 15,841,195
Owner education
High school diploma or less 8.9% 8.9% 19.1% 24.3%
Tech school 2.5% 3.0% 6.1% 5.3%
Some college 11.6% 10.5% 13.4% 13.7%
Associate 5.0% 3.7% 5.1% 4.0%
Bachelor 25.4% 27.0% 15.9% 18.4%
Masters, Doctorate, or
Professional Degree 20.5% 27.8% 10.6% 12.4%
Not reported 26.1% 19.1% 29.8% 22.0%
Owner previously self-employed 20.3% 30.5% 20.6% 32.6%
Source: Authors’ own analysis of 2007 Survey of Business Owners (U.S. Census Bureau)
Table 10. Race/Ethnicity and Age of Business Owners by Gender and Field (2007 SBO)
Women-owned Men-owned Women-owned Men-owned
STEM STEM non-STEM non-STEM
N 1,819,021 3,454,597 9,541,546 15,841,195
Race/Ethnicity*
White 86.9% 90.0% 81.2% 87.0%
Black 5.1% 3.5% 9.8% 5.7%
Asian 5.9% 5.0% 6.5% 5.4%
Other 2.2% 1.5% 2.5% 2.0%
Hispanic 6.7% 5.2% 10.3% 9.2%
Owner age**
Under 25 1.4% 1.3% 1.9% 1.6%
25 to 34 8.6% 7.2% 8.6% 7.8%
35 to 44 17.2% 15.5% 15.4% 16.1%
45 to 54 23.0% 22.3% 20.6% 23.2%
55 to 64 16.2% 22.2% 16.3% 19.1%
65 or over 6.6% 12.6% 7.5% 10.5%
Not reported 26.0% 18.9% 29.6% 21.7%
Source: Authors’ own analysis of 2007 Survey of Business Owners (U.S. Census Bureau)
*Respondents able to select one or more race/ethnicity with which they identify
** Age categories reflect those presented to respondents in the SBO questionnaire (2007)