
Page 63 - Technology and Innovation Journal - 19-1
P. 63
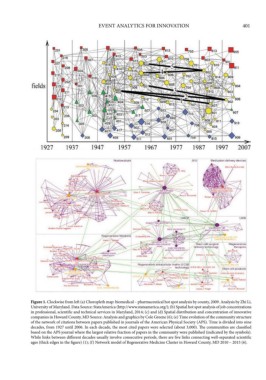
EVENT ANALYTICS FOR INNOVATION                         401


             Figure 1. Clockwise from left (a) Choropleth map: biomedical – pharmaceutical hot spot analysis by county, 2009. Analysis by Zhi Li,
             University of Maryland. Data Source: StatsAmerica (http://www.statsamerica. org/); (b) Spatial hot spot analysis of job concentrations
             in professional, scientific and technical services in Maryland, 2014; (c) and (d) Spatial distribution and concentration of innovative
             companies in Howard County, MD Source: Analysis and graphics by Cole Greene (6); (e) Time evolution of the community structure
             of the network of citations between papers published in journals of the American Physical Society (APS). Time is divided into nine
             decades, from 1927 until 2006. In each decade, the most cited papers were selected (about 3,000). The communities are classified
             based on the APS journal where the largest relative fraction of papers in the community were published (indicated by the symbols).
             While links between different decades usually involve consecutive periods, there are five links connecting well-separated scientific
             ages (thick edges in the figure) (1); (f) Network model of Regenerative Medicine Cluster in Howard County, MD 2010 – 2015 (6).