
Page 155 - MARSIUM'21 COMP OF PAPER
P. 155
133 Dayang Permai (2022)
This research surveyed 100 respondents to determine the components that contribute to the analysis of Petronas Festive Advertisement as an
audience emotion influence on young adults among Kampung Baru residents. Additionally, the researcher determines the sample size in this
study using simple random sampling. Thirty respondents were employed in the pilot test for the reliability test. Utilizing this basic random
selection strategy makes it easier to elicit responses to the questionnaire. Once collecting data among all questionnaires administered, the
researcher may do frequency distribution analysis, descriptive analysis, and reliability analysis on the collected data. Additionally, if the
researcher wishes to ascertain the existence of a relationship between the independent variables, he or she may use regression and correlation
analysis.
4.0 DATA ANALYSIS PLAN
4.1 INTRODUCTION
All data are taken from 100 surveys sent randomly through Google form and WhatsApp application, and the analysis of the findings is
provided in the next part in the form of tables. The Statistical Package for Social Sciences (SPSS) software was used to analyse the
respondents' responses. The data indicate that respondents are capable of responding to all research questions, therefore accomplishing the
study's goals. Additionally, the results indicate whether the hypotheses will be evaluated.
4.2 DESCRIPTIVE ANALYSIS
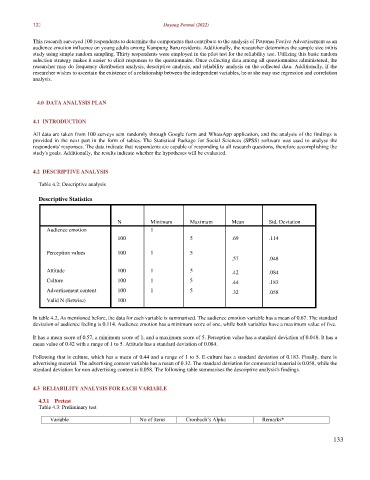
Table 4.2: Descriptive analysis
Descriptive Statistics
N Minimum Maximum Mean Std. Deviation
Audience emotion 1
100 5 .69 .114
Perception values 100 1 5
.57 .048
Attitude 100 1 5 .42 .084
Culture 100 1 5 .44 .183
Advertisement content 100 1 5 .32 .058
Valid N (listwise) 100
In table 4.2, As mentioned before, the data for each variable is summarised. The audience emotion variable has a mean of 0.67. The standard
deviation of audience feeling is 0.114. Audience emotion has a minimum score of one, while both variables have a maximum value of five.
It has a mean score of 0.57, a minimum score of 1, and a maximum score of 5. Perception value has a standard deviation of 0.048. It has a
mean value of 0.42 with a range of 1 to 5. Attitude has a standard deviation of 0.084.
Following that is culture, which has a mean of 0.44 and a range of 1 to 5. E-culture has a standard deviation of 0.183. Finally, there is
advertising material. The advertising content variable has a mean of 0.32. The standard deviation for commercial material is 0.058, while the
standard deviation for non-advertising content is 0.058. The following table summarises the descriptive analysis's findings.
4.3 RELIABILITY ANALYSIS FOR EACH VARIABLE
4.3.1 Pretest
Table 4.3: Preliminary test
Variable No of items Cronbach’s Alpha Remarks*
133