
Page 258 - MARSIUM'21 COMP OF PAPER
P. 258
perceived value and four items for consumers’ purchasing intention. All the measurement items were adapted and adopted
from a previous study by Moslehpour et al. (2021). A five-point Likert scale was developed in Section B of the questionnaire.
The scale was numbered from 1 to 5 representing strongly disagree (1), disagree (2), neutral (3), agree (4) and strongly agree
(5). After data collection, Statistical Package for the Social Sciences (SPSS) was used to process and analyze the collected
data.
4.0 DATA ANALYSIS
4.1 RESPONSE RATE
This study used a quantitative method where data was collected through online questionnaires created in Google Form. The
targeted respondent for this study was parents who had children between ages 3 to 6 and had the intention to send them to
preschool education. Sets of online questionnaires were distributed through Facebook, LinkedIn, WhatsApp and Instagram.
The targeted sample size of this study is 200. At the end of the data collection, 264 sets of responses were received. Out of the
264 sets questionnaires, there were 47 responses that did not fulfill the qualifying questions. Hence, there were 217 sets of
valid responses with the response rate of 82.2%.
4.2 DATA SCREENING
Detection of the outliers among all the variables was conducted in the study. The variables include entertainment (ENT),
interaction (INT), trust (TR), perceived value (PV) and purchase intention (PI). All the data collected underwent SPSS analysis
to detect the outlier. After the analysis, there were some outliers detected. For interaction, there were 5 cases with outliers
which are in case 143, 149, 155, 159 and 198 while for perceived value, case 8 was detected with outliers which are case 9,
145, 149, 152, 159, 166, 204 and 244. Next, for purchase intention, there were 7 cases with outliers which included case 9,
145, 149, 198, 204, 209 and 224. Thus, a total of 13 cases (case 9, 143, 145, 149, 152, 155, 159, 166, 198, 204, 209, 224 and
244) with outliers were deleted. Hence, there were 204 samples used for further data analysis.
4.3 PROFILE OF RESPONDENTS
There were 8 questions regarding the respondents' profile in the survey. The questions were gender, age, educational level,
employment, monthly income. This survey also consists of questions including number of kids between 3-6 years old, average
time spent on social media per day and type of social media used to visit a preschool or kindergarten page.
Based on the data collected, females represented most of the respondents which is 65.2% (133 respondents). Next,
most of the respondents were in the range of 31 - 40 years old with 130 respondents (63.7%). Respondents possessing the
educational level of bachelor represented the highest amount of data with 103 respondents or 50.5%. In addition, most of the
respondents were working in the private sector with 59.3% (121 respondents). 21.1% of the respondents (43 respondents) had
the monthly income of RM 3001 to RM 4000. There were 63.7% or 130 respondents with one kid between 3-6 years old.
Moreover, most of the respondents spent 2-3 hours on social media per day with 49.0% (100 respondents). There were 135
respondents (66.2%) used Facebook to visit a preschool or kindergarten page.
4.4 DESCRIPTIVE ANALYSIS
The finding showed that purchase intention had the highest mean which was 4.09 while trust had the lowest mean of 3.95.
Besides, the mean for other variables of entertainment, interaction and perceived value were 4.00, 4.05 and 4.01 respectively.
In addition, the highest standard deviation among the variables was trust (0.64) while the purchase intention possessed the
lowest standard deviation of 0.53. Moreover, the standard deviation for the variable entertainment, interaction and perceived
value were 0.62, 0.59 and 0.60 respectively.
4.5 SCALE MEASUREMENT
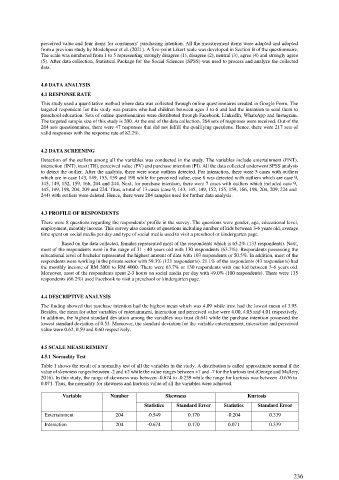
4.5.1 Normality Test
Table 1 shows the result of a normality test of all the variables in the study. A distribution is called approximate normal if the
value of skewness ranges between -2 and +2 while the value ranges between +7 and -7 for the kurtosis test (George and Mallery,
2016). In this study, the range of skewness was between -0.674 to -0.239 while the range for kurtosis was between -0.636 to
0.071. Thus, the normality for skewness and kurtosis value of all the variables were achieved.
Variable Number Skewness Kurtosis
Statistics Standard Error Statistics Standard Error
Entertainment 204 -0.549 0.170 -0.204 0.339
Interaction 204 -0.674 0.170 0.071 0.339
236