
Page 259 - MARSIUM'21 COMP OF PAPER
P. 259
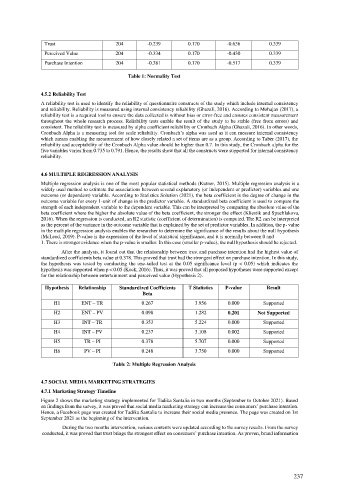
Trust                    204        -0.239        0.170         -0.636         0.339
                 Perceived Value          204        -0.334        0.170         -0.430         0.339
                 Purchase Intention       204        -0.381        0.170         -0.517         0.339

                                              Table 1: Normality Test


               4.5.2 Reliability Test
               A reliability test is used to identify the reliability of questionnaire constructs of the study which include internal consistency
               and reliability. Reliability is measured using internal consistency reliability (Ghazali, 2016). According to Mohajan (2017), a
               reliability test is a required tool to ensure the data collected is without bias or error-free and ensures consistent measurement
               throughout the whole research process. Reliability tests enable the result of the study to be stable (free from errors) and
               consistent. The reliability test is measured by alpha coefficient reliability or Cronbach Alpha (Ghazali, 2016). In other words,
               Cronbach Alpha is a measuring tool for scale reliability. Cronbach’s alpha was used as it can measure internal consistency
               which means enabling the measurement of how closely related a set of items are as a group. According to Taber (2017), the
               reliability and acceptability of the Cronbach Alpha value should be higher than 0.7. In this study, the Cronbach alpha for the
               five variables varies from 0.735 to 0.791. Hence, the results show that all the constructs were supported for internal consistency
               reliability.


               4.6 MULTIPLE REGRESSION ANALYSIS
               Multiple regression analysis is one of the most popular statistical methods (Kutner, 2015). Multiple regression analysis is a
               widely used method to estimate the associations between several explanatory (or independent or predictor) variables and one
               outcome (or dependent) variable. According to Statistics Solution (2021), the beta coefficient is the degree of change in the
               outcome variable for every 1-unit of change in the predictor variable. A standardized beta coefficient is used to compare the
               strength of each independent variable to the dependent variable. This can be interpreted by comparing the absolute value of the
               beta coefficient where the higher the absolute value of the beta coefficient, the stronger the effect (Kliestik and Spuchlakova,
               2016). When the regression is conducted, an R2 statistic (coefficient of determination) is computed. The R2 can be interpreted
               as the percent of the variance in the outcome variable that is explained by the set of predictor variables. In addition, the p- value
               in the multiple regression analysis enables the researcher to determine the significance of the results about the null hypothesis
               (McLeod, 2019). P-value is the expression of the level of statistical significance, and it is normally between 0 and
               1. There is stronger evidence when the p-value is smaller. In this case (smaller p-value), the null hypothesis should be rejected.

                       After the analysis, it found out that the relationship between trust and purchase intention had the highest value of
               standardized coefficients beta value at 0.378. This proved that trust had the strongest effect on purchase intention. In this study,
               the  hypothesis was tested by conducting the one-tailed test  at  the 0.05 significance level  (p < 0.05) which indicates the
               hypothesis was supported when p < 0.05 (Kock, 2016). Thus, it was proved that all proposed hypotheses were supported except
               for the relationship between entertainment and perceived value (Hypothesis 2).

                 Hypothesis   Relationship   Standardized Coefficients   T Statistics   P-value   Result
                                                   Beta
                    H1        ENT – TR             0.267              3.956      0.000       Supported
                    H2        ENT – PV             0.098              1.282      0.201     Not Supported
                    H3        INT – TR             0.353              5.224      0.000       Supported
                    H4        INT – PV             0.237              3.108      0.002       Supported
                    H5         TR – PI             0.378              5.707      0.000       Supported
                    H6         PV – PI             0.248              3.750      0.000       Supported

                                         Table 2: Multiple Regression Analysis


               4.7 SOCIAL MEDIA MARKETING STRATEGIES
               4.7.1 Marketing Strategy Timeline
               Figure 2 shows the marketing strategy implemented for Tadika Santalia in two months (September to October 2021). Based
               on findings from the survey, it was proved that social media marketing strategy can increase the consumers’ purchase intention.
               Hence, a Facebook page was created for Tadika Santalia to increase their social media presence. The page was created on 1st
               September 2021 as the beginning of the intervention.
                       During the two months intervention, various contents were updated according to the survey results. From the survey
                conducted, it was proved that trust brings the strongest effect on consumers’ purchase intention. As proven, brand information


                                                                                                        237