
Page 394 - MARSIUM'21 COMP OF PAPER
P. 394
373 Lim Huey Nee & Mazilah (2022)
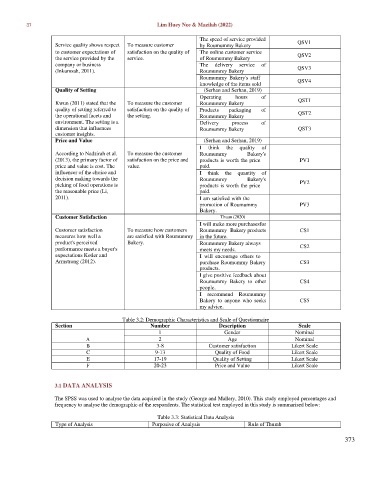
The speed of service provided
Service quality shows respect To measure customer by Roumummy Bakery QSV1
to customer expectations of satisfaction on the quality of The online customer service QSV2
the service provided by the service. of Roumummy Bakery
company or business The delivery service of
(Inkumsah, 2011). Roumummy Bakery QSV3
Roumummy Bakery's staff QSV4
knowledge of the items sold
Quality of Setting (Serhan and Serhan, 2019)
Operating hours of QST1
Kwun (2011) stated that the To measure the customer Roumummy Bakery
quality of setting referred to satisfaction on the quality of Products packaging of
the operational facets and the setting. Roumummy Bakery QST2
environment. The setting is a Delivery process of
dimension that influences Roumummy Bakery QST3
customer insights.
Price and Value (Serhan and Serhan, 2019)
I think the quality of
According to Nadzirah et al. To measure the customer Roumummy Bakery's
(2013), the primary factor of satisfaction on the price and products is worth the price PV1
price and value is cost. The value. paid.
influencer of the choice and I think the quantity of
decision making towards the Roumummy Bakery's
picking of food operations is products is worth the price PV2
the reasonable price (Li, paid.
2011). I am satisfied with the
promotion of Roumummy PV3
Bakery.
Customer Satisfaction Thuan (2020)
I will make more purchases for
Customer satisfaction To measure how customers Roumummy Bakery products CS1
measures how well a are satisfied with Roumummy in the future.
product's perceived Bakery. Roumummy Bakery always
performance meets a buyer's meets my needs. CS2
expectations Kotler and I will encourage others to
Armstrong (2012). purchase Roumummy Bakery CS3
products.
I give positive feedback about
Roumummy Bakery to other CS4
people.
I recommend Roumummy
Bakery to anyone who seeks CS5
my advice.
Table 3.2: Demographic Characteristics and Scale of Questionnaire
Section Number Description Scale
1 Gender Nominal
A 2 Age Nominal
B 3-8 Customer satisfaction Likert Scale
C 9-13 Quality of Food Likert Scale
E 17-19 Quality of Setting Likert Scale
F 20-23 Price and Value Likert Scale
3.1 DATA ANALYSIS
The SPSS was used to analyse the data acquired in the study (George and Mallery, 2010). This study employed percentages and
frequency to analyse the demographic of the respondents. The statistical test employed in this study is summarised below:
Table 3.3: Statistical Data Analysis
Type of Analysis Purposive of Analysis Rule of Thumb
373