
Page 395 - MARSIUM'21 COMP OF PAPER
P. 395
374 Lim Huey Nee & Mazilah (2022)
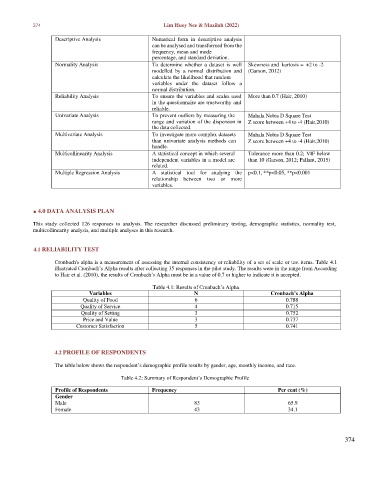
Descriptive Analysis Numerical form in descriptive analysis
can be analysed and transformed from the
frequency, mean and mode
percentage, and standard deviation.
Normality Analysis To determine whether a dataset is well Skewness and kurtosis = +2 to -2
modelled by a normal distribution and (Garson, 2012)
calculate the likelihood that random
variables under the dataset follow a
normal distribution.
Reliability Analysis To ensure the variables and scales used More than 0.7 (Hair, 2010)
in the questionnaire are trustworthy and
reliable.
Univariate Analysis To prevent outliers by measuring the Mahala Nobis D Square Test
range and variation of the dispersion in Z score between +4 to -4 (Hair,2010)
the data collected.
Multivariate Analysis To investigate more complex datasets Mahala Nobis D Square Test
than univariate analysis methods can Z score between +4 to -4 (Hair,2010)
handle.
Multicollinearity Analysis A statistical concept in which several Tolerance more than 0.2; VIF below
independent variables in a model are than 10 (Garson, 2012; Pallant, 2015)
related.
Multiple Regression Analysis A statistical tool for studying the p<0.1, **p<0.05, **p<0.001
relationship between two or more
variables.
■ 4.0 DATA ANALYSIS PLAN
This study collected 126 responses to analysis. The researcher discussed preliminary testing, demographic statistics, normality test,
multicollinearity analysis, and multiple analyses in this research.
4.1 RELIABILITY TEST
Cronbach's alpha is a measurement of assessing the internal consistency or reliability of a set of scale or test items. Table 4.1
illustrated Cronbach’s Alpha results after collecting 35 responses in the pilot study. The results were in the range from According
to Hair et al. (2010), the results of Cronbach’s Alpha must be in a value of 0.7 or higher to indicate it is accepted.
Table 4.1: Results of Cronbach’s Alpha
Variables N Cronbach’s Alpha
Quality of Food 6 0.788
Quality of Service 4 0.715
Quality of Setting 3 0.752
Price and Value 3 0.737
Customer Satisfaction 5 0.741
4.2 PROFILE OF RESPONDENTS
The table below shows the respondent’s demographic profile results by gender, age, monthly income, and race.
Table 4.2: Summary of Respondent’s Demographic Profile
Profile of Respondents Frequency Per cent (%)
Gender
Male 83 65.9
Female 43 34.1
374