
Page 396 - MARSIUM'21 COMP OF PAPER
P. 396
375 Lim Huey Nee & Mazilah (2022)
Age
18-24 years old 38 30.2
25-34 years old 52 41.3
35-44 years old 23 18.3
45-54 years old 9 7.1
55-64 years old 3 2.0
65 years old and above 1 0.7
Monthly Income
RM4,850 and below 68 54.0
Between RM4,851 per to RM10,970 34 27.0
Exceeds RM10,971 24 19.0
Race
Malay 37 29.4
Chinese 83 65.9
Indian 6 4.8
Other 0 0
4.1 PRELIMINARY TESTING: COMPLIANCE WITH REGRESSION ASSUMPTIONS
This research conducted a preliminary test to satisfy the multiple regression analysis’s assumptions. The assumptions were the
normal data: there were no extreme values (outliners) and no multicollinearity issues.
4.1.1 NORMALITY TEST
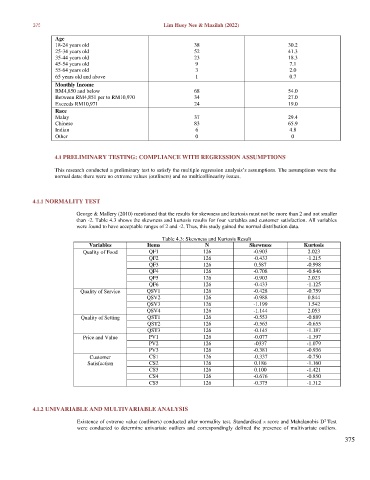
George & Mallery (2010) mentioned that the results for skewness and kurtosis must not be more than 2 and not smaller
than -2. Table 4.3 shows the skewness and kurtosis results for four variables and customer satisfaction. All variables
were found to have acceptable ranges of 2 and -2. Thus, this study gained the normal distribution data.
Table 4.3: Skewness and Kurtosis Result
Variables Items N Skewness Kurtosis
Quality of Food QF1 126 -0.903 2.023
QF2 126 -0.433 -1.215
QF3 126 0.587 -0.998
QF4 126 -0.708 -0.846
QF5 126 -0.903 2.023
QF6 126 -0.433 -1.125
Quality of Service QSV1 126 -0.428 -0.759
QSV2 126 -0.988 0.844
QSV3 126 -1.199 1.542
QSV4 126 -1.144 2.053
Quality of Setting QST1 126 -0.553 -0.889
QST2 126 -0.563 -0.655
QST3 126 -0.145 -1.187
Price and Value PV1 126 -0.077 -1.397
PV2 126 -0337 -1.079
PV3 126 -0.381 -0.936
Customer CS1 126 -0.337 -0.750
Satisfaction CS2 126 0.186 -1.160
CS3 126 0.100 -1.421
CS4 126 -0.676 -0.850
CS5 126 -0.375 -1.312
4.1.2 UNIVARIABLE AND MULTIVARIABLE ANALYSIS
2
Existence of extreme value (outliners) conducted after normality test. Standardised z score and Mahalanobis D Test
were conducted to determine univariate outliers and correspondingly defined the presence of multivariate outliers.
375