
Page 397 - MARSIUM'21 COMP OF PAPER
P. 397
376 Lim Huey Nee & Mazilah (2022)
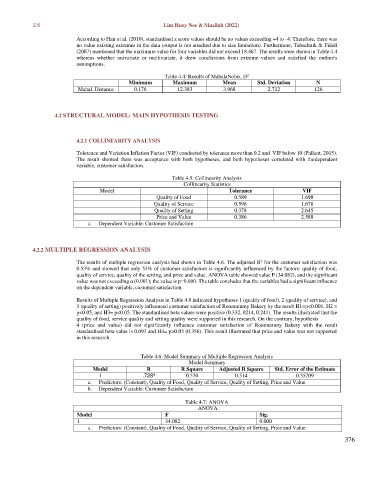
According to Hair et al. (2010), standardised z score values should be no values exceeding +4 to -4. Therefore, there was
no value existing extremes in the data (output is not attached due to size limitation). Furthermore, Tabachnik & Fidell
(2007) mentioned that the maximum value for four variables did not exceed 18.467. The results were shown in Table 4.4
whereas whether univariate or multivariate, it drew conclusions from extreme values and satisfied the outline's
assumptions.
Table 4.4: Results of MahalaNobis, D
2
Minimum Maximum Mean Std. Deviation N
Mahal. Distance 0.176 12.383 3.968 2.712 126
4.2 STRUCTURAL MODEL: MAIN HYPOTHESIS TESTING
4.2.1 COLLINEARITY ANALYSIS
Tolerance and Variation Inflation Factor (VIF) conducted by tolerance more than 0.2 and VIF below 10 (Pallant, 2015).
The result showed there was acceptance with both hypotheses, and both hypotheses correlated with the dependent
variable, customer satisfaction.
Table 4.5: Collinearity Analysis
Collinearity Statistics
Model Tolerance VIF
Quality of Food 0.589 1.698
Quality of Service 0.596 1.678
Quality of Setting 0.378 2.645
Price and Value 0.386 2.588
a. Dependent Variable: Customer Satisfaction
4.2.2 MULTIPLE REGRESSION ANALYSIS
2
The results of multiple regression analysis had shown in Table 4.6. The adjusted R for the customer satisfaction was
0.53% and showed that only 53% of customer satisfaction is significantly influenced by the factors: quality of food,
quality of service, quality of the setting, and price and value. ANOVA table showed value F (34.082), and the significant
value was not exceeding α (0.001); the value is p=0.000. The table concludes that the variables had a significant influence
on the dependent variable, customer satisfaction.
Results of Multiple Regression Analysis in Table 4.8 indicated hypotheses 1 (quality of food), 2 (quality of service), and
3 (quality of setting) positively influenced customer satisfaction of Roumummy Bakery by the result H1=p<0.001, H2 =
p<0.05, and H3= p<0.05. The standardised beta values were positive (0.332, 0214, 0.241). The results illustrated that the
quality of food, service quality and setting quality were supported in this research. On the contrary, hypothesis
4 (price and value) did not significantly influence customer satisfaction of Roumummy Bakery with the result
standardised beta value is 0.093 and H4= p>0.05 (0.356). This result illustrated that price and value was not supported
in this research.
Table 4.6: Model Summary of Multiple Regression Analysis
Model Summary
Model R R Square Adjusted R Square Std. Error of the Estimate
a
1 .728 0.530 0.514 0.55209
a. Predictors: (Constant), Quality of Food, Quality of Service, Quality of Setting, Price and Value
b. Dependent Variable: Customer Satisfaction
Table 4.7: ANOVA
ANOVA
Model F Sig.
1 34.082 0.000
a. Predictors: (Constant), Quality of Food, Quality of Service, Quality of Setting, Price and Value
376