
Page 410 - MARSIUM'21 COMP OF PAPER
P. 410
4.0 DATA ANALYSIS
4.1 RESPONSE RATE
The quantitative method was adopted in this study by creating online questionnaires through Google Forms and distributing them to
the target respondents. The Google Forms questionnaire was distributed via social media platforms such as Instagram, WhatsApp, Facebook,
and LinkedIn. Two qualifying questions, which are “Do you have your own internet data plan such as postpaid or prepaid data plan?” and
“Have you liked and followed any of a telecommunication brand such as Maxis, Digi, or Celcom in social media?” were developed to select
the targeted respondents who were eligible to answer the survey. Based on the calculation of the subject-to-item ratio of 5:1, the minimum
sample size of this study was 205. A total of 291 sets of online questionnaires were distributed to the targeted respondents. However, only
210 responses were returned with 81 sets of responses of did not like and follow any of a telecommunication brand. Thus, the usable
questionnaires were 210 with a response rate of 72.16 percent.
4.2 DATA PREPARATION AND SCREENING
In this study, SPSS was utilized to identify the outlier, normality, and missing value. This process can ensure the normal distribution of
data and avoid errors. The findings of outlier and normality are included in the analysis.
4.2.1 Detection of Outliers
Boxplot value for all the 210 samples to detect the outliers among all the variables. From the findings for detection of outliers, the
consumption (CONS) construct found outlier for sample 103. Initially, there were 210 responses in the study. After the analysis, there
was one outlier should be deleted: the sample of 103 in the variable of consumption. Hence, this study used 209 samples for data
analysis.
4.2.2 Detection of Normality
Using a normality test, sample data can be verified whether from a population with normally distributed (Patnaik, 2018). According
to Das and Imon (2016), normality is important to achieve statistical findings. This is because the statistics of normal distributed can
better represent the population due to the possibility of having the same result is higher. Statistical software “SPSS” can be used to run
the normality tests (Mishra et al., 2019). For the coefficients of skewness and kurtosis are numerical methods. However, the normality
test is a more formal method that requires to evaluate whether a given set of data has a normal distribution (Siraj, 2019).
According to Kwak and Park (2019), the “asymmetry” measurement of the probability distribution is skewness, where the curve
seems distorted or skewed left or skewed right. In contrast, the “tailedness” measurement of the probability distribution is kurtosis,
where the tails are asymptotically close to zero or not close to zero. A symmetric distribution, or data collection, seems like the same
to the left and right side of the central point. A symmetric distribution has the same mean, median, and mode, such as skewness is
zero or kurtosis (excess) is 0. If the skewness or kurtosis (excess) of the data is between − 1 and + 1, the distribution is considered
approximation normal (Mishra et al., 2019). Thus, before beginning data analysis, SPSS is being used as a screening tool to identify
and validate the normality of data.
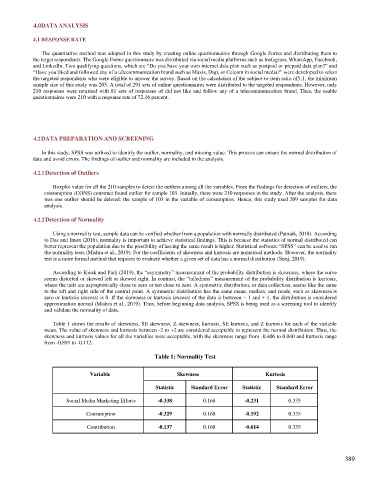
Table 1 shows the results of skewness, SE skewness, Z skewness, kurtosis, SE kurtosis, and Z kurtosis for each of the variable
mean. The value of skewness and kurtosis between -2 to +2 are considered acceptable to represent the normal distribution. Thus, the
skewness and kurtosis values for all the variables were acceptable, with the skewness range from -0.406 to 0.040 and kurtosis range
from -0.891 to -0.112.
Table 1: Normality Test
Variable Skewness Kurtosis
Statistic Standard Error Statistic Standard Error
Social Media Marketing Efforts -0.338 0.168 -0.231 0.335
Consumption -0.329 0.168 -0.192 0.335
Contribution -0.137 0.168 -0.614 0.335
389