
Page 411 - MARSIUM'21 COMP OF PAPER
P. 411
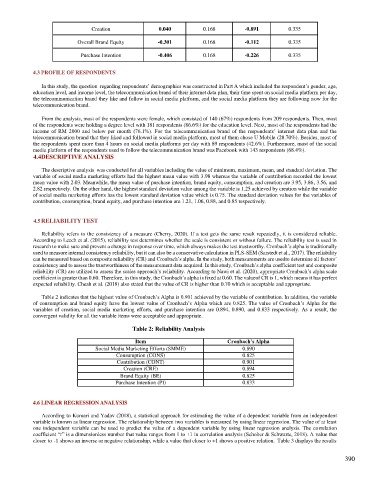
Creation               0.040         0.168         -0.891        0.335

                           Overall Brand Equity      -0.301         0.168         -0.112        0.335

                            Purchase Intention       -0.406         0.168         -0.226        0.335

            4.3 PROFILE OF RESPONDENTS

               In this study, the question  regarding respondents’ demographics was constructed in Part A which included the respondent’s gender, age,
            education level, and income level, the telecommunication brand of their internet data plan, their time spent on social media platform per day,
            the telecommunication brand they like and follow in social media platform, and the social media platform they are following now for the
            telecommunication brand.

               From the analysis, most of the respondents were female, which consisted of 140 (67%) respondents from 209 respondents. Then, most
            of the respondents were holding a degree level with 181 respondents (86.6%) for the education level. Next, most of the respondents had the
            income  of  RM  2000  and  below  per  month  (76.1%).  For  the  telecommunication  brand  of  the  respondents’  internet  data  plan  and  the
            telecommunication brand that they liked and followed in social media platform, most of them chose U Mobile (28.70%). Besides, most of
            the respondents spent more than 4 hours on social media platforms per day with 89 respondents (42.6%). Furthermore, most of the social
            media platform of the respondents used to follow the telecommunication brand was Facebook with 143 respondents (68.4%).
            4.4 DESCRIPTIVE ANALYSIS

               The descriptive analysis  was conducted for all variables including the value of minimum, maximum, mean, and standard deviation. The
            variable of social media marketing efforts had the highest mean value with 3.98 whereas the variable of contribution recorded the lowest
            mean value with 2.03. Meanwhile, the mean value of purchase intention, brand equity, consumption, and creation are 3.95, 3.86, 3.56, and
            2.82 respectively. On the other hand, the highest standard deviation value among the variable is 1.25 achieved by creation while the variable
            of social media marketing efforts has the lowest standard deviation value which is 0.75. The standard deviation values for the variables of
            contribution, consumption, brand equity, and purchase intention are 1.21, 1.06, 0.88, and 0.85 respectively.


            4.5 RELIABILITY TEST

               Reliability refers to the consistency of a measure (Cherry, 2020). If a test gets the same result repeatedly, it is considered reliable.
            According to Leech et al. (2015), reliability test determines whether the scale is consistent or without failure. The reliability test is used in
            research to make sure and prevent a change in response over time, which always makes the test trustworthy. Cronbach’s alpha is traditionally
            used to measure internal consistency reliability, but it can also be a conservative calculation in PLS-SEM (Sarstedt et al., 2017). The reliability
            can be measured based on composite reliability (CR) and Cronbach’s alpha. In the study, both measurements are used to determine all factors’
            consistency and to assess the trustworthiness of the measurement data acquired. In this study, Cronbach’s alpha coefficient test and composite
            reliability (CR) are utilized to assess the scales approach’s reliability. According to Nawi et al. (2020), appropriate Cronbach’s alpha scale
            coefficient is greater than 0.60. Therefore, in this study, the Cronbach’s alpha is fixed at 0.60. The value of CR is 1, which means it has perfect
            expected reliability. Cheah et al. (2018) also stated that the value of CR is higher than 0.70 which is acceptable and appropriate.

               Table 2 indicates that the highest value of Cronbach’s Alpha is 0.901 achieved by the variable of contribution. In addition, the variable
            of consumption and brand equity have the lowest value of Cronbach’s Alpha which are 0.825. The value of Cronbach’s Alpha for the
            variables of creation, social media marketing efforts,  and purchase intention are 0.894, 0.890, and 0.833 respectively. As a  result, the
            convergent validity for all the variable items were acceptable and appropriate.

                                             Table 2: Reliability Analysis

                                              Item                          Cronbach’s Alpha
                                 Social Media Marketing Efforts (SMME)           0.890
                                       Consumption (CONS)                        0.825
                                        Contribution (CONT)                      0.901
                                          Creation (CRE)                         0.894
                                         Brand Equity (BE)                       0.825
                                       Purchase Intention (PI)                   0.833


            4.6 LINEAR REGRESSION ANALYSIS

               According to Kumari and Yadav (2018), a statistical approach for estimating the value of a dependent variable from an independent
            variable is known as linear regression. The relationship between two variables is measured by using linear regression. The value of at least
            one independent variable can be used to predict the value of a dependent variable by using linear regression analysis. The correlation
            coefficient “r” is a dimensionless number that value ranges from 1 to +1 in correlation analysis (Schober & Schwarte, 2018). A value that
            closer to -1 shows an inverse or negative relationship, while a value that closer to +1 shows a positive relation.  Table 3 displays the results


                                                                                                                   390