
Page 437 - MARSIUM'21 COMP OF PAPER
P. 437
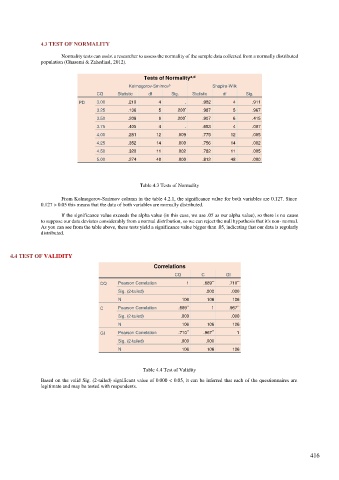
4.3 TEST OF NORMALITY

                       Normality tests can assist a researcher to assess the normality of the sample data collected from a normally distributed
               population (Ghasemi & Zahediasl, 2012).

                                                    Tests of Normality a,d

                                              Kolmogorov-Smirnov   b        Shapiro-Wilk
                                   CQ     Statistic   df     Sig.    Statistic   df    Sig.
                             PD    3.00       .210       4        .     .982       4      .911
                                   3.25       .136       5     .200   *  .987      5      .967
                                   3.50       .209       6     .200   *  .907      6      .415
                                   3.75       .405       4        .     .683       4      .007
                                   4.00       .281      12     .009     .775      12      .005
                                   4.25       .352      14     .000     .756      14      .002
                                   4.50       .320      11     .002     .782      11      .005
                                   5.00       .274      48     .000     .812      48      .000


                                                  Table 4.3 Tests of Normality

                       From Kolmogorov-Smirnov column in the table 4.2.1, the significance value for both variables are 0.127. Since
               0.127 > 0.05 this means that the data of both variables are normally distributed.
                       If the significance value exceeds the alpha value (in this case, we use .05 as our alpha value), so there is no cause
               to suppose our data deviates considerably from a normal distribution, so we can reject the null hypothesis that it's non- normal.
               As you can see from the table above, these tests yield a significance value bigger than .05, indicating that our data is regularly
               distributed.


     4.4 TEST OF VALIDITY

                                                       Correlations
                                                              CQ        C       GI
                                                                           **
                                                                                    **
                                    CQ     Pearson Correlation     1     .689    .710
                                           Sig. (2-tailed)               .000     .000
                                           N                     106      106      106
                                                                   **
                                                                                    **
                                    C      Pearson Correlation   .689      1     .967
                                           Sig. (2-tailed)      .000              .000
                                           N                     106      106      106
                                                                           **
                                                                   **
                                    GI     Pearson Correlation   .710    .967       1

                                           Sig. (2-tailed)      .000     .000
                                           N                     106      106      106


                                                   Table 4.4 Test of Validity

               Based on the valid Sig. (2-tailed) significant value of 0.000 < 0.05, it can be inferred that each of the questionnaires are
               legitimate and may be tested with respondents.


                                                                                                              416