
Page 439 - MARSIUM'21 COMP OF PAPER
P. 439
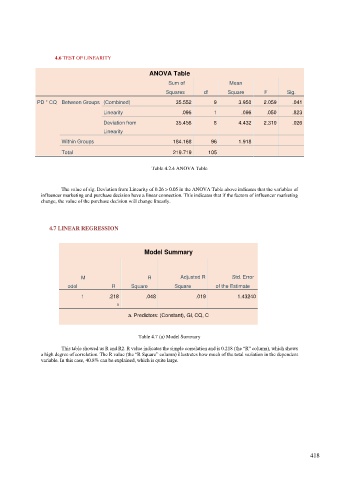
4.6 TEST OF LINEARITY

                                                     ANOVA Table

                                                            Sum of                Mean

                                                           Squares       df      Square       F       Sig.
              PD * CQ  Between Groups  (Combined)              35.552       9        3.950    2.059     .041

                                     Linearity                   .096       1         .096     .050     .823

                                     Deviation from            35.456       8        4.432    2.310     .026
                                     Linearity

                       Within Groups                          184.168      96        1.918

                       Total                                  219.719     105

                                                      Table 4.2.4 ANOVA Table


                       The value of sig. Deviation from Linearity of 0.26 > 0.05 in the ANOVA Table above indicates that the variables of
               influencer marketing and purchase decision have a linear connection. This indicates that if the factors of influencer marketing
               change, the value of the purchase decision will change linearly.


                  4.7 LINEAR REGRESSION


                                                    Model Summary


                              M                      R          Adjusted R         Std. Error
                         odel           R      Square         Square         of the Estimate
                              1        .218         .048              .019          1.43240
                                          a
                                              a. Predictors: (Constant), GI, CQ, C


                                                  Table 4.7 (a) Model Summary

                       This table showed us R and R2. R value indicates the simple correlation and is 0.218 (the “R” column), which shows
               a high degree of correlation. The R value (the “R Square” column) illustrates how much of the total variation in the dependent
               variable. In this case, 40.8% can be explained, which is quite large.


                                                                                                              418