
Page 440 - MARSIUM'21 COMP OF PAPER
P. 440
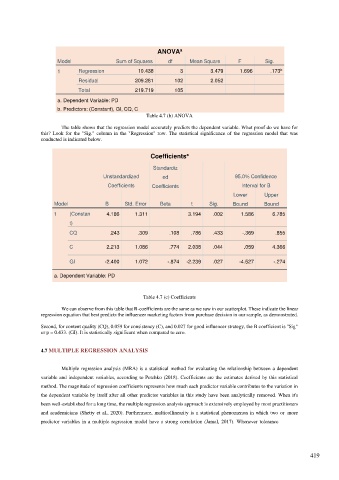
ANOVA
                                                                a
                     Model                Sum of Squares    df      Mean Square      F        Sig.
                                                                                                    b
                     1       Regression          10.438         3          3.479     1.696      .173
                             Residual           209.281       102          2.052
                             Total              219.719       105
                     a. Dependent Variable: PD
                     b. Predictors: (Constant), GI, CQ, C
                                                    Table 4.7 (b) ANOVA

                       The table shows that the regression model accurately predicts the dependent variable. What proof do we have for
               this?  Look  for  the  "Sig."  column  in  the  "Regression"  row.  The statistical  significance  of  the  regression  model  that  was
               conducted is indicated below.

                                                                   a
                                                      Coefficients
                                                       Standardiz

                                     Unstandardized       ed                        95.0% Confidence
                                       Coefficients   Coefficients                    Interval for B
                                                                                   Lower      Upper

                    Model             B      Std. Error   Beta      t      Sig.    Bound      Bound
                    1    (Constan     4.186     1.311              3.194    .002      1.586      6.785
                         t)
                         CQ             .243     .309       .108    .786    .433      -.369       .855


                         C            2.213     1.086       .774   2.038    .044       .059      4.366

                         GI           -2.400    1.072       -.874   -2.239   .027    -4.527      -.274

                    a. Dependent Variable: PD


                                                   Table 4.7 (c) Coefficients

                       We can observe from this table that B-coefficients are the same as we saw in our scatterplot. These indicate the linear
               regression equation that best predicts the influencer marketing factors from purchase decision in our sample, as demonstrated.

               Second, for content quality (CQ), 0.059 for consistency (C), and 0.027 for good influencer strategy, the B coefficient is "Sig"
               or p = 0.433. (GI). It is statistically significant when compared to zero.


               4.7 MULTIPLE REGRESSION ANALYSIS


                       Multiple regression analysis (MRA) is a statistical method for evaluating the relationship between a dependent
               variable and independent variables, according to Petchko (2018). Coefficients are the estimates derived by this statistical
               method. The magnitude of regression coefficients represents how much each predictor variable contributes to the variation in
               the dependent variable by itself after all other predictor variables in this study have been analytically removed. When it's
               been well-established for a long time, the multiple regression analysis approach is extensively employed by most practitioners
               and academicians (Shetty et al., 2020). Furthermore, multicollinearity is a statistical phenomenon in which two or  more
               predictor variables in  a multiple  regression model  have a strong correlation  (Jamal,  2017). Whenever tolerance


                                                                                                              419