
Page 569 - MARSIUM'21 COMP OF PAPER
P. 569
respondents used social media 5 hours or more daily. Based on the survey, 88.0% of the respondents (n=132) bought baking
supplies for their personal use, while 12.0% of the respondents (n=18) bought baking supplies for their business.
4.2 Normality Test
According to Mishra et al. (2019), normality test is an important step to determine the measures of central tendency and statistical
methods for data analysis. Razali and Yap (2011) explained the importance of normal distribution as an underlying assumption of
statistical methods. Razali and Yap (2011) explained that if the assumption of normality is violated, interpretation and deduction
may be invalid and unreliable. Normality can be tested using Statistical Package for the Social Sciences (SPSS). Statistically,
skewness and kurtosis are used to test for normality (Ghasemi & Zalhediasl, 2012). Skewness is used to measure the asymmetry,
while kurtosis is used to measure the pointiness of a distribution (Kim, 2013). Skewness value of zero is usually implying symmetric
distribution. Negative value will generate a left-skewed while positive value will generate a right-skewed graph. The data is deemed
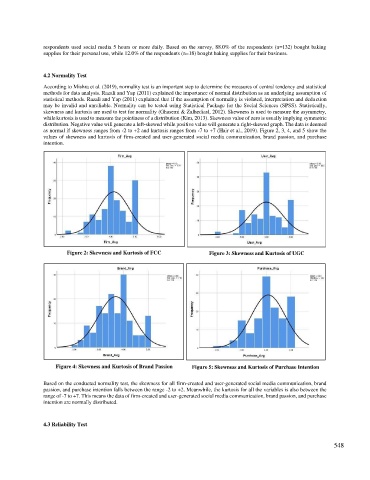
as normal if skewness ranges from -2 to +2 and kurtosis ranges from -7 to +7 (Hair et al., 2019). Figure 2, 3, 4, and 5 show the
values of skewness and kurtosis of firm-created and user-generated social media communication, brand passion, and purchase
intention.
Figure 2: Skewness and Kurtosis of FCC Figure 3: Skewness and Kurtosis of UGC
Figure 4: Skewness and Kurtosis of Brand Passion Figure 5: Skewness and Kurtosis of Purchase Intention
Based on the conducted normality test, the skewness for all firm-created and user-generated social media communication, brand
passion, and purchase intention falls between the range -2 to +2. Meanwhile, the kurtosis for all the variables is also between the
range of -7 to +7. This means the data of firm-created and user-generated social media communication, brand passion, and purchase
intention are normally distributed.
4.3 Reliability Test
548