
Page 570 - MARSIUM'21 COMP OF PAPER
P. 570
measure as well as explains the relationship between the number of questions, issues, or tasks in the test and the score reliability
(Livingston, 2018). Generally, the accepted rule is Cronbach Alpha of 0.6 to 0.7, indicating an acceptable of reliability level, while
0.8 and above indicates a very good level (Ursachi, Horodnic, & Zait, 2015).
Results from the reliability test shows that firm-created social media communication, user-generated social media
communication, and purchase intention shows a very good reliable level as their Cronbach’s Alpha value are more than 0.8, which
are 0.876, 0.870, and 0.836 respectively. On the other hand, brand passion (0.767) is considered as an acceptable reliability level.
In short, all variables are reliable for this study.
4.4 Regression Analysis
Regression analysis is a statistical procedure which allows researchers to investigate the relationship between one dependent
variable and two or more independent variables (Salkind, 2011). Regression analysis can be divided to linear and multiple
regression analysis. Linear regression is the simplest form of regression analysis which measures the relationship between two
variables (Kumari & Yadav, 2018). Meanwhile, multiple regression indicates there are more than one independent variables
involved with one dependent variable (Uyanık & Güler, 2013).
The estimates developed by regression analysis are known as coefficients (Petchko, 2018). As a part of the regression
analysis process, several assumptions are reviewed and tested to ensure that researchers can obtain a valid result (Hair et al., 2019).
According to Petchko (2018), the statistical significance for each coefficient is decided by comparing the significance probability
or p-value. The most commonly used level of significance is 5% (0.05). Hence, the coefficient is interpreted as being statistically
significant if the p-value is smaller than the level of significance. Meanwhile, if the p-value is greater, the coefficient is interpreted
as being not significant. A linear regression analysis was conducted in this study to investigate the relationships between firm-
created with user-generated social media communication and brand passion with purchase intention of baking products, while a
multiple regression analysis was conducted to investigate the relationships between firm-created and user-generated social media
communication and brand passion.
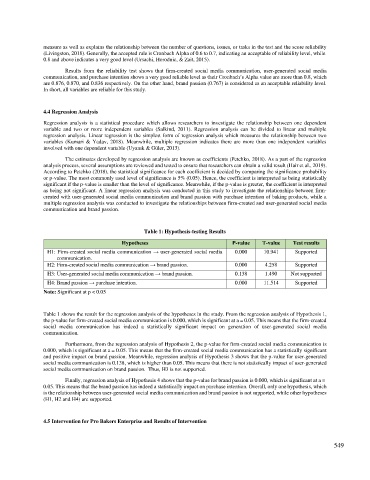
Table 1: Hypothesis-testing Results
Hypotheses P-value T-value Test results
H1: Firm-created social media communication → user-generated social media 0.000 10.941 Supported
communication.
H2: Firm-created social media communication → brand passion. 0.000 4.258 Supported
H3: User-generated social media communication → brand passion. 0.138 1.490 Not supported
H4: Brand passion → purchase intention. 0.000 11.514 Supported
Note: Significant at p < 0.05
Table 1 shows the result for the regression analysis of the hypotheses in the study. From the regression analysis of Hypothesis 1,
the p-value for firm-created social media communication is 0.000, which is significant at a = 0.05. This means that the firm-created
social media communication has indeed a statistically significant impact on generation of user-generated social media
communication.
Furthermore, from the regression analysis of Hypothesis 2, the p-value for firm-created social media communication is
0.000, which is significant at a = 0.05. This means that the firm-created social media communication has a statistically significant
and positive impact on brand passion. Meanwhile, regression analysis of Hypothesis 3 shows that the p-value for user-generated
social media communication is 0.138, which is higher than 0.05. This means that there is not statistically impact of user-generated
social media communication on brand passion. Thus, H3 is not supported.
Finally, regression analysis of Hypothesis 4 shows that the p-value for brand passion is 0.000, which is significant at a =
0.05. This means that the brand passion has indeed a statistically impact on purchase intention. Overall, only one hypothesis, which
is the relationship between user-generated social media communication and brand passion is not supported, while other hypotheses
(H1, H2 and H4) are supported.
4.5 Intervention for Pro Bakers Enterprise and Results of Intervention
549