
Page 786 - MARSIUM'21 COMP OF PAPER
P. 786
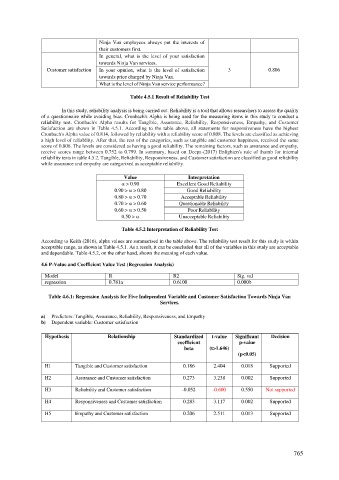
Ninja Van employees always put the interests of
their customers first.
In general, what is the level of your satisfaction
towards Ninja Van services.
Customer satisfaction In your opinion, what is the level of satisfaction 3 0.806
towards price charged by Ninja Van.
What is the level of Ninja Van service performance?
Table 4.5.1 Result of Reliability Test
In this study, reliability analysis is being carried out. Reliability is a tool that allows researchers to assess the quality
of a questionnaire while avoiding bias. Cronbach's Alpha is being used for the measuring items in this study to conduct a
reliability test. Cronbach's Alpha results for Tangible, Assurance, Reliability, Responsiveness, Empathy, and Customer
Satisfaction are shown in Table 4.5.1. According to the table above, all statements for responsiveness have the highest
Cronbach's Alpha value of 0.814, followed by reliability with a reliability score of 0.808. The levels are classified as achieving
a high level of reliability. After that, the rest of the categories, such as tangible and customer happiness, received the same
score of 0.806. The levels are considered as having a good reliability. The remaining factors, such as assurance and empathy,
receive scores range between 0.752 to 0.799. In summary, based on Deepa-(2017) Enlighten's rule of thumb for internal
reliability tests in table 4.5.2, Tangible, Reliability, Responsiveness, and Customer satisfaction are classified as good reliability
while assurance and empathy are categorized as acceptable reliability.
Value Interpretation
> 0.90 Excellent Good Reliability
0.90 > > 0.80 Good Reliability
0.80 > > 0.70 Acceptable Reliability
0.70 > > 0.60 Questionable Reliability
0.60 > > 0.50 Poor Reliability
0.50 > Unacceptable Reliability
Table 4.5.2 Interpretation of Reliability Test
According to Keith (2016), alpha values are summarised in the table above. The reliability test result for this study is within
acceptable range, as shown in Table 4.5.1. As a result, it can be concluded that all of the variables in this study are acceptable
and dependable. Table 4.5.2, on the other hand, shows the meaning of each value.
4.6 P-Value and Coefficient Value Test (Regression Analysis)
Model R R2 Sig. val
regression 0.781a 0.6100 0.000b
Table 4.6.1: Regression Analysis for Five Independent Variable and Customer Satisfaction Towards Ninja Van
Services.
a) Predictors: Tangible, Assurance, Reliability, Responsiveness, and Empathy
b) Dependent variable: Customer satisfaction
Hypothesis Relationship Standardized t-value Significant Decision
coefficient p-value
beta (t>1.646)
(p<0.05)
H1 Tangible and Customer satisfaction 0.186 2.404 0.018 Supported
H2 Assurance and Customer satisfaction 0.273 3.238 0.002 Supported
H3 Reliability and Customer satisfaction -0.052 -0.600 0.550 Not supported
H4 Responsiveness and Customer satisfaction 0.283 3.117 0.002 Supported
H5 Empathy and Customer satisfaction 0.206 2.511 0.013 Supported
765