
Page 784 - MARSIUM'21 COMP OF PAPER
P. 784
and distance, as well as the benefit of starting from a set zero point. The comparison can be conducted in terms of
respondent’s age that obtained ratio in this case.
4.2 Profile of Respondents
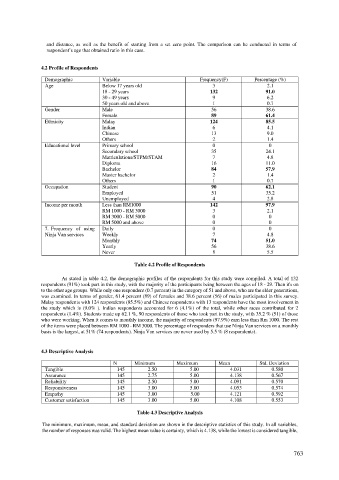
Demographic Variable Frequency(F) Percentage (%)
Age Below 17 years old 3 2.1
18 - 29 years 132 91.0
30 - 49 years 9 6.2
50 years old and above 1 0.7
Gender Male 56 38.6
Female 89 61.4
Ethnicity Malay 124 85.5
Indian 6 4.1
Chinese 13 9.0
Others 2 1.4
Educational level Primary school 0 0
Secondary school 35 24.1
Matriculations/STPM/STAM 7 4.8
Diploma 16 11.0
Bachelor 84 57.9
Master bachelor 2 1.4
Others 1 0.7
Occupation Student 90 62.1
Employed 51 35.2
Unemployed 4 2.8
Income per month Less than RM1000 142 97.9
RM 1000 - RM 3000 3 2.1
RM 3000 - RM 5000 0 0
RM 5000 and above 0 0
7. Frequency of using Daily 0 0
Ninja Van services Weekly 7 4.8
Monthly 74 51.0
Yearly 56 38.6
Never 8 5.5
Table 4.2 Profile of Respondents
As stated in table 4.2, the demographic profiles of the respondents for this study were compiled. A total of 132
respondents (91%) took part in this study, with the majority of the participants being between the ages of 18 - 29. Then it's on
to the other age groups. While only one respondent (0.7 percent) in the category of 51 and above, who are the elder generations,
was examined. In terms of gender, 61.4 percent (89) of females and 38.6 percent (56) of males participated in this survey.
Malay respondents with 124 respondents (85.5%) and Chinese respondents with 13 respondents have the most involvement in
the study which is (9.0% ). Indian respondents accounted for 6 (4.1%) of the total, while other races contributed for 2
respondents (1.4%). Students made up 62.1 %, 90 respondents of those who took part in the study, with 35.2 % (51) of those
who were working. When it comes to monthly income, the majority of respondents (97.9%) earn less than Rm 1000. The rest
of the items were placed between RM 1000 - RM 3000. The percentage of responders that use Ninja Van services on a monthly
basis is the largest, at 51% (74 respondents). Ninja Van services are never used by 5.5 % (8 respondents).
4.3 Descriptive Analysis
N Minimum Maximum Mean Std. Deviation
Tangible 145 2.50 5.00 4.031 0.580
Assurance 145 2.75 5.00 4.138 0.567
Reliability 145 2.50 5.00 4.091 0.570
Responsiveness 145 3.00 5.00 4.053 0.574
Empathy 145 3.00 5.00 4.121 0.592
Customer satisfaction 145 3.00 5.00 4.108 0.553
Table 4.3 Descriptive Analysis
The minimum, maximum, mean, and standard deviation are shown in the descriptive statistics of this study. In all variables,
the number of responses was valid. The highest mean value is certainty, which is 4.138, while the lowest is considered tangible,
763