
Page 783 - MARSIUM'21 COMP OF PAPER
P. 783
on the research's purpose. The study's target sample size was 100 people. According to Malhotra (2012), a minimum sample
size of 100 respondents is required for the research to be consistent. As a result, a total of 145 respondents were chosen for
this study.
3.3 Pilot test
The pilot test has been used for this study, and students from the Bachelor of Marketing Management programme at
Universiti Teknologi Malaysia (UTM) in Skudai are being the respondents. During the semester break in August 2021, 30
students enrolled in the Bachelor of Management (Marketing) programme got the survey forms. In addition, the respondents
were given a Google Form questionnaire to fill out. When the pilot test is completed, some of the respondents gave suggestions
for my research question to make an improvement.
3.4 RESEARCH INSTRUMENT
For this study, a quantitative approach (Likert scale questions) was considered most appropriate. Part A, B, and C are the three
sections of the questionnaire. Part A consists of seven straightforward questions about the information provided by the
respondent. Part B, on the other side, had nineteen measuring items in terms of tangible, assurance, reliability, responsiveness,
and empathy for the independent variable (IV). Part C followed with three questions about the dependent variable (DV) in
terms of customer satisfaction in general. The series of questions asks respondents to choose from a list of options. Closed-
ended questionnaires are the primary tool used in this research. In this study, a set of questionnaires was created using the
categorical, multiple choice, and Likert scale. The strength of the answer is determined using the five-point Likert scale.
According to Vagias and Wade (2006), the Likert scale determines five levels of agreement: strongly disagree = 1, disagree =
2, neutral = 3, agree = 4, and strongly agree = 5.
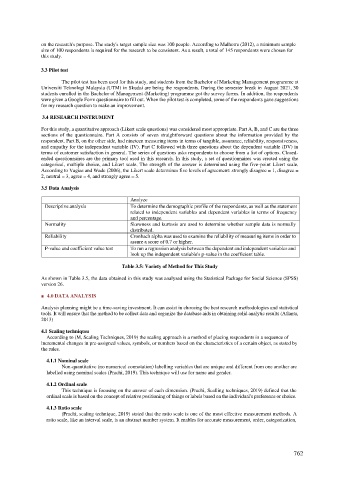
3.5 Data Analysis
Analyze
Descriptive analysis To determine the demographic profile of the respondents, as well as the statement
related to independent variables and dependent variables in terms of frequency
and percentage.
Normality Skewness and kurtosis are used to determine whether sample data is normally
distributed.
Reliability Cronbach alpha was used to examine the reliability of measuring items in order to
assure a score of 0.7 or higher.
P-value and coefficient value test To run a regression analysis between the dependent and independent variables and
look up the independent variable's p-value in the coefficient table.
Table 3.5: Variety of Method for This Study
As shown in Table 3.5, the data obtained in this study was analysed using the Statistical Package for Social Science (SPSS)
version 26.
■ 4.0 DATA ANALYSIS
Analysis planning might be a time-saving investment. It can assist in choosing the best research methodologies and statistical
tools. It will ensure that the method to be collect data and organize the database aids in obtaining solid analytic results (Atlanta,
2013)
4.1 Scaling techniques
According to (M, Scaling Techniques, 2019) the scaling approach is a method of placing respondents in a sequence of
incremental changes in pre-assigned values, symbols, or numbers based on the characteristics of a certain object, as stated by
the rules.
4.1.1 Nominal scale
Non-quantitative (no numerical connotation) labelling variables that are unique and different from one another are
labelled using nominal scales (Prachi, 2019). This technique will use for name and gender.
4.1.2 Ordinal scale
This technique is focusing on the answer of each dimension. (Prachi, Scalling techniques, 2019) defined that the
ordinal scale is based on the concept of relative positioning of things or labels based on the individual's preference or choice.
4.1.3 Ratio scale
(Prachi, scaling technique, 2019) stated that the ratio scale is one of the most effective measurement methods. A
ratio scale, like an interval scale, is an abstract number system. It enables for accurate measurement, order, categorization,
762