
Page 883 - MARSIUM'21 COMP OF PAPER
P. 883
884
4.2 RESPONDENTS BACKGROUND
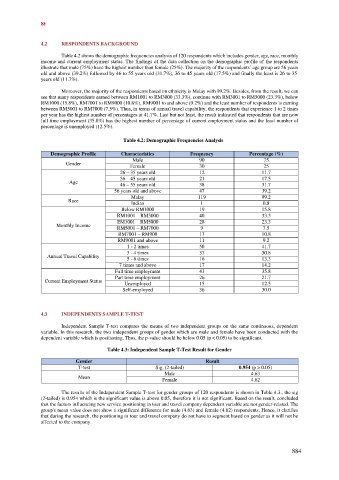
Table 4.2 shows the demographic frequencies analysis of 120 respondents which includes gender, age, race, monthly
income and current employment status. The findings of the data collection on the demographic profile of the respondents
illustrate that male (75%) have the highest number than female (25%). The majority of the respondents’ age group are 56 years
old and above (39.2%) followed by 46 to 55 years old (31.7%), 36 to 45 years old (17.5%) and finally the least is 26 to 35
years old (11.7%).
Moreover, the majority of the respondents based on ethnicity is Malay with 99.2%. Besides, from the result, we can
see that many respondents earned between RM1001 to RM3000 (33.3%), continue with RM3001 to RM5000 (23.3%), below
RM1000 (15.8%), RM7001 to RM9000 (10.8%), RM9001 to and above (9.2%) and the least number of respondents is earning
between RM5001 to RM7000 (7.5%). Thus, in terms of annual travel capability, the respondents that experience 1 to 2 times
per year has the highest number of percentages at 41.7%. Last but not least, the result indicated that respondents that are now
full time employment (35.8%) has the highest number of percentage of current employment status and the least number of
percentage is unemployed (12.5%).
Table 4.2: Demographic Frequencies Analysis
Demographic Profile Characteristics Frequency Percentage (%)
Male 90 75
Gender Female 30 25
26 – 35 years old 12 11.7
Age 36 – 45 years old 21 17.5
46 – 55 years old 38 31.7
56 years old and above 47 39.2
Malay 119 99.2
Race Indian 1 0.8
Below RM1000 19 15.8
RM1001 – RM3000 40 33.3
Monthly Income EM3001 – RM5000 28 23.3
RM5001 – RM7000 9 7.5
RM7001 – RM900 13 10.8
RM9001 and above 11 9.2
1 - 2 times 50 41.7
Annual Travel Capability 3 - 4 times 37 30.8
5 - 6 times 16 13.3
7 times and above 17 14.2
Full time employment 43 35.8
Current Employment Status Part time employment 26 21.7
12.5
Unemployed
15
Self-employed 36 30.0
4.3 INDEPENDENTS SAMPLE T-TEST
Independent Sample T-test compares the means of two independent groups on the same continuous, dependent
variable. In this research, the two independent groups of gender which are male and female have been conducted with the
dependent variable which is positioning. Thus, the p-value should be below 0.05 (p < 0.05) to be significant.
Table 4.3: Independent Sample T-Test Result for Gender
Gender Result
T-test Sig. (2-tailed) 0.954 (p > 0.05)
Male 4.63
Mean
Female 4.62
The results of the Independent Sample T-test for gender groups of 120 respondents is shown in Table 4.3., the sig
(2-tailed) is 0.954 which is the significant value is above 0.05, therefore it is not significant. Based on the result, concluded
that the factors influencing new service positioning in tour and travel company dependent variable are not gender-related. The
group's mean value does not show a significant difference for male (4.63) and female (4.62) respondents. Hence, it clarifies
that during the research, the positioning in tour and travel company do not have to segment based on gender as it will not be
affected to the company.
884