
Page 882 - MARSIUM'21 COMP OF PAPER
P. 882
883
3.3 RESEARCH INSTRUMENT
The use of a quantitative method, such as Likert scale questions, was deemed to be the most appropriate approach
for this study. The questionnaire is divided into three sections, which are referred to as parts A, B, and C. Part A consists of
six straightforward questions about the demographic profile of those who answered them. The independent variables, which
included service innovation, customer segmentation, and brand endorsement, were covered in 15 questions in Part B. Finally,
Part C had five measurement items that were related to dependent variables, which was the positioning of the subject. Each of
the questions in the collection of surveys asks the respondents to select one option from a list. The purpose of a Likert scale is
to determine the strength of an answer, with levels of agreement ranging from strongly agree to agree, neutral to disagree, and
strongly disagree to severely disagree.
■ 4.0 FINDING AND ANALYSIS
4.1 DATA ANALYSIS
This study's data was analysed using the IBM Statistical Package for Social Science (SPSS) version 27. SPSS is a
well-known software application that is used to test the relationship between independent variables (service innovation,
reliability, and brand endorsement) and dependent variables (positioning of tour and travel company). The frequencies analysis
was used to analyze the demographic information given by the respondents and the results reflect on what the data is or means.
Hence, by summarizing in tables it helps to understand the descriptive analysis background and the distribution of the data.
The data analysis was carried out in two stages, of which the first stage involved examining the measuring model and the
second stage consisted of the construction of a complete structural equation model (Dhiman et al., 2019). The data was analysed
using a normality test, reliability analysis, descriptive statistics, multiple regressions and one-way ANOVA test.
The first stage is to measure the normality test and reliability test. Data normality (the approval range of skewing is ± 1)
was assessed based on skewness and kurtosis tests. Cronbach’s alpha was used to assess the inner accuracy of problems related
to the Likert scale. Variance from 0 to 7 is widely reckoned to signify the internal stability of the findings (Pallant, 2005). In
the second stage followed by Multiple Linear Regression. Multiple Linear Regression analysis, which refers to the most
commonly used method to analyze quantitative data, had been carried out as it is an incredibly powerful pool to determines
which correlations among the variables had the most significant effect and prediction (Ghauri et al., 2020). The higher the R2;
the higher is the percentage of variation of the dependent variable explained by the independent variables. When the p-value
is less than 0.05, Multiple Linear Regression is significant (Lee et al., 2018). The results of the regression would be to determine
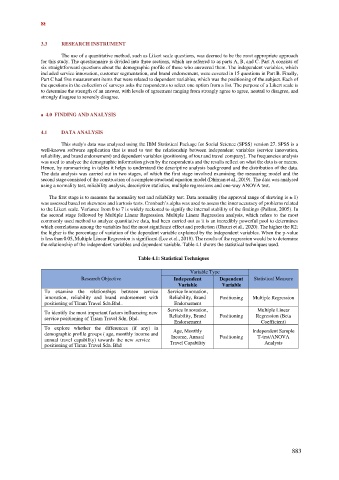
the relationship of the independent variables and dependent variable. Table 4.1 shows the statistical techniques used.
Table 4.1: Statistical Techniques
Variable Type
Research Objective Independent Dependent Statistical Measure
Variable Variable
To examine the relationships between service Service Innovation,
innovation, reliability and brand endorsement with Reliability, Brand Positioning Multiple Regression
positioning of Tiram Travel Sdn.Bhd.. Endorsement
To identify the most important factors influencing new Service Innovation, Multiple Linear
service positioning of Tiram Travel Sdn. Bhd. Reliability, Brand Positioning Regression (Beta
Endorsement Coefficient)
To explore whether the differences (if any) in Age, Monthly Independent Sample
demographic profile groups ( age, monthly income and Income, Annual Positioning T-test/ANOVA
annual travel capability) towards the new service
positioning of Tiram Travel Sdn. Bhd Travel Capability Analysis
883